

CMS Releases 2016 Medicare Parts B and D Drug Spending Data
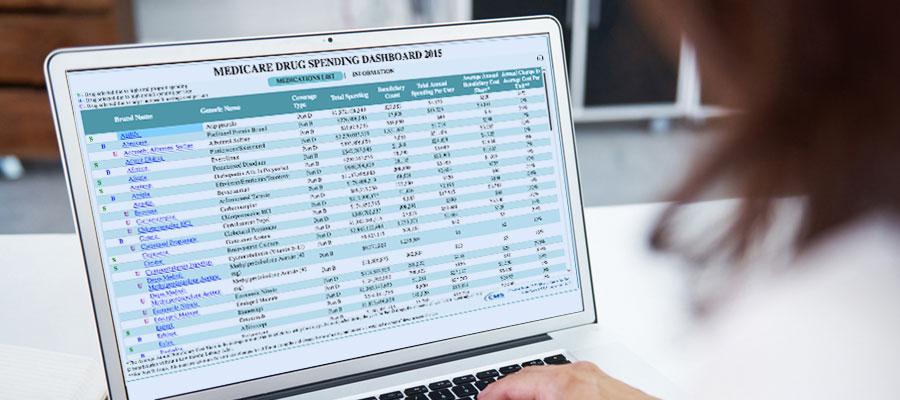
The Centers for Medicare & Medicaid Services today updated the Parts B and D drug spending dashboards with 2016 information. The dashboards provide pricing and utilization information for drugs covered under Medicare Parts B and D, including the total amount the program spent on a covered drug, how many beneficiaries used the drug, the cost per unit and the change in price from the prior year. Today’s update adds new fields, including the Average Sales Price, the number of manufacturers producing the drug, and what the drug is used to treat. This information is now available for all covered Part B and D drugs. The 2016 data show double-digit increases in spending per unit (i.e., price) for 876 Part D drugs and 145 Part B drugs, with 31 drugs increasing by more than 100%. CMS also released updated data on the prescription drugs prescribed by individual physicians and other providers paid under Medicare Part D.