


Award
The proposed Physician Led and Rural Access to Quality Care Act (H.R. 2191 and S. 1390 in the 119th Congress) would establish exceptions to the current nationwide ban on creating new physician-owned hospitals (POHs) in rural areas and lift restrictions on the expansion of all existing POHs, regardless of location. Specifically, the legislation would allow for the establishment of new physician-owned rural hospitals that are more than a 35-mile drive from a main patient campus of a hospital or critical access hospital, and it would eliminate current-law restrictions on the expansion of grandfathered physician-owned hospitals.
POHs typically focus on a specific range of services, such as cardiac or orthopedic care, and serve a patient base that is generally healthier and more likely to be commercially insured compared to those treated in rural community hospitals. Rural community hospitals tend to serve older, sicker populations who typically rely on Medicare and Medicaid.
Our analysis uses Medicare Fee-for-Service (FFS) claims, Medicare Advantage encounter data, and cost report data to model the impacts of three hypothetical types of POHs (cardiac, orthopedic or other) entering the market of a Sole Community Hospital (SCH). SCHs were chosen for this analysis as they are by definition at least 35 road miles from any other hospital and thus likely to be rural.
Our analysis shows that the introduction of a POH could negatively impact the financial health of existing SCHs by siphoning profitable service types and reducing their proportion of healthier, commercially insured patients. Notably, across all three scenarios tested, the introduction of a POH led to reduced overall margins for existing SCHs and overall financial losses in two of the scenarios, exacerbating the financial instability of these hospitals.
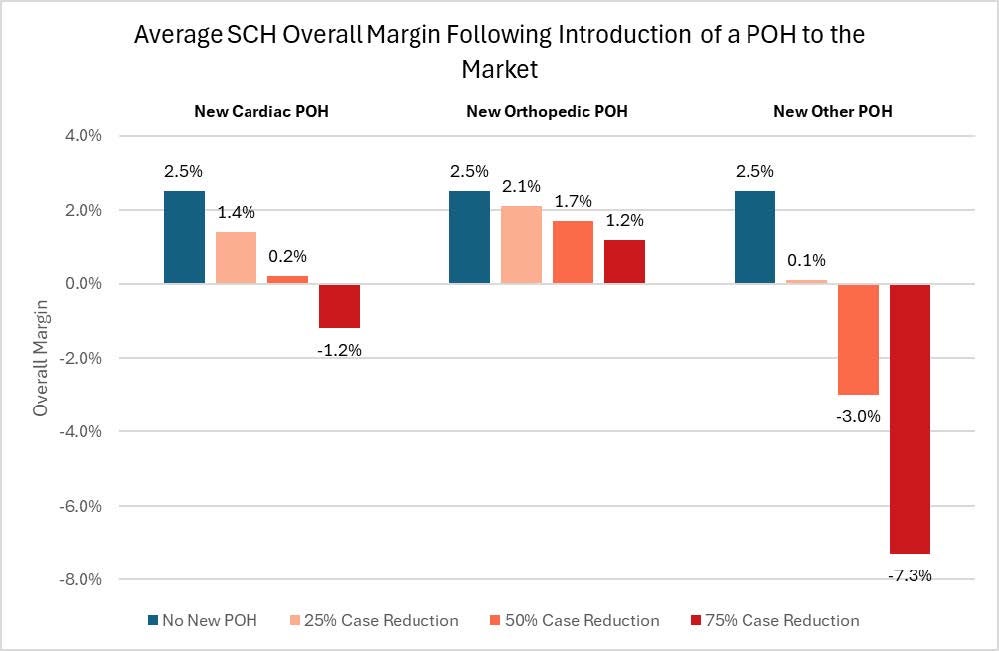
Relative to the average SCH margin of 2.5%, the entry of an orthopedic POH could reduce overall margins from 2.1% (a 25% case reduction) to 1.2% (a 75% case reduction). The introduction of a cardiac POH could result in overall margins ranging from 1.4% to -1.2%. The introduction of an ‘other’ POH could lower overall margins to 0.1% to -7.3%. In summary, the SCH overall margin is highly sensitive to the magnitude of volume loss, with greater reduction in case volume leading to negative overall margins in most scenarios.

SCHs play a critical role in providing health care services to millions of people in underserved communities, ensuring they have access to essential medical care. With many SCHs already challenged by low or negative margins, the expansion of POHs may threaten the financial viability of these institutions, potentially diminishing health care access and quality in rural areas, while also harming the local economy.
The Physician Led and Rural Access to Quality Care Act (H.R. 2191 and S. 1390 in the 119th Congress), would amend the current law restrictions on physician-owned hospitals (POHs) by allowing them to open in rural areas. Congress enacted a ban on the establishment of new POHs and placed restrictions on the growth of existing POHs due to concerns with POHs’ patterns of physician self-referrals, minimal emergency services, and disproportionate care provided to profitable patients.1 Under H.R. 2191 and S.1390, new POHs would be allowed to open in rural areas with another existing hospital, provided that the POH would be located more than 35 miles away (or 15 miles in areas of mountainous terrain) from the existing hospital. The bills would also allow the expansion of existing POHs.2
POHs are generally focused on providing specific services, such as cardiac and orthopedic surgery, and tend to serve a patient population that is healthier and more likely to have commercial insurance compared to patients at other acute care hospitals.3,4,5,6 In contrast, rural community hospitals provide a broad range of vital health care services to approximately 60 million people in rural communities, who are more likely to be older, sicker, and be covered by public health insurance or be uninsured than people living in urban areas.7 Higher complexity patient populations, combined with lower patient volumes, contribute to the financial instability of rural hospitals. Since 2010, 152 rural hospitals have fully or partially closed, with many more on the brink of closure.8 Revenues from higher paying commercially insured and healthier patients help to offset the losses hospitals incur from treating sicker, publicly insured and uninsured patients, and from offering unprofitable but essential services to support their communities.
Given these realities and the differences that exist between POHs and rural hospitals, the entry of a POH into a rural market could negatively impact existing rural hospitals. POHs may attract more profitable service lines and commercially insured patients away from rural hospitals, leaving existing rural hospitals with a higher proportion of sicker, vulnerable and uninsured patients. This shift would exacerbate an already strained financial environment and threaten the viability of rural hospitals across the country.
Considering this potential policy change, the Federation of American Hospitals and the American Hospital Association commissioned Dobson DaVanzo and Associates, LLC (Dobson | DaVanzo) to explore the possible impacts of a POH opening in a rural community. This study builds on prior work comparing POHs to other hospital types.9
Rural hospitals are integral to the well-being of their communities, often serving as the core source of health care in remote areas. These hospitals are essential to the health and well-being of the patients and communities they serve and operate as economic anchors in their local communities by creating jobs and generating income.10 In 2020, rural hospitals supported one in every 12 rural jobs in the U.S. and generated $220 billion in economic activity in rural communities.11
However, rural hospitals face numerous challenges, including low patient volume, low margins, severe workforce shortages, and geographic barriers that naturally limit access to care. Lower population densities in rural areas result in comparatively lower patient volumes that make it challenging for rural hospitals to cover their fixed-operating costs. As financial pressures rise, many rural hospitals are downsizing or closing, leading to reduced access to essential inpatient services, such as obstetric care. In turn, the reduction of obstetric services increases risks of adverse birth outcomes for women and infants. The loss of essential services often leads to a broader decline in hospital offerings, further harming the health status and access of the entire rural community.12
This study focuses on sole community hospitals (SCHs), a specific subset of rural hospitals. As their name suggests, these hospitals are the sole hospital provider for an entire community and, by definition, are located at least 35 road miles from any other hospital.13 Further, SCHs provide a broad range of services to the community and are therefore particularly vulnerable to the adverse effects of the entry of a POH into their market.
POHs are hospitals owned and operated wholly or in part by physicians. While POHs can be full-service general hospitals, they primarily focus on specific services such as cardiac and orthopedic surgery, and are often small, for-profit facilities with fewer than 100 beds. Our prior analysis found that POHs generally treat a younger, less complex and comorbid population, that is less likely to be dually eligible for Medicare and Medicaid, and less likely to be non-white.14 Our study found that POHs have higher margins and lower unreimbursed and uncompensated care costs as a percent of net patient revenue compared to non-POHs.15 POHs also typically receive more admissions through physician or clinic referrals, fewer Medicare admissions, and fewer admissions through emergency departments when compared to non-POHs.16,17
POHs that focus on specific services (such as cardiac or orthopedic services) are generally smaller and less likely to provide intensive care services than other POHs. Patients admitted to these facilities typically have shorter lengths of stay and fewer comorbidities. As an example, orthopedic POHs treat patients with fewer comorbidities and perform fewer major joint (total hip or total knee) replacements than other hospitals.18 Commonly reported procedures and associated diagnoses among orthopedic POHs include rotator cuff repair, carpal tunnel repair, arthroscopic knee surgery, osteoarthritis, capsulitis, sprain in shoulder or upper arm region, knee tear, chondromalacia (“runner’s knee”), and sprain in knee or leg.19,20
Furthermore, studies show that markets with cardiac POHs treat higher volumes of profitable cardiac procedures, such as coronary artery bypass graft surgery.21 Compared to community hospitals, cardiac POHs also tend to have higher shares of low-severity cases, patients with commercial insurance, and patients with fewer comorbidities.22,23
Overall, POHs generally have both higher utilization rates and use of profitable services than non-POHs, suggesting that hospital ownership may affect physicians’ treatment approaches.24,25 POHs tend to admit more patients with fewer chronic conditions and more generous insurance coverage, when compared to non-POHs.26,27,28 One study found that cardiac POHs obtained their market share by shifting healthier and lower-severity patients away from community hospitals.29
Another study found that when cardiac POHs enter a market, POHs tend to target healthier, more profitable patient populations for treatment, leaving other hospitals with a sicker patient population. Cardiac POHs also tend to enter markets with healthier patients and lower mortality rates.30 In summary, the published literature suggests that POHs often provide selected services that are more profitable and serve healthier, commercially insured patients compared to non-POHs, leaving the remaining existing facilities, such as SCHs, to treat a sicker and costlier patient population.
Given the introduction of legislation that would end the moratorium on POHs entering rural areas, Dobson | DaVanzo modeled the extent to which a POH entering a rural hospital’s market could negatively impact the existing rural hospital by siphoning profitable service types and reducing the proportion of healthier, commercially insured patients. Dobson | DaVanzo modeled the impact of a cardiac, an orthopedic, and an ‘other’ POH entering the market on the overall and Medicare margins of an existing SCH. Claims and cost report data for 421 SCHs in CY 2022 was averaged to produce a hypothetical SCH, based on Medicare revenues and costs per claim by both Medicare Severity Diagnosis Related Group (MS-DRG) and Ambulatory Payment Classification (APC). Medicare revenues and costs were reduced for select DRGs and APCs identified as a core POH case type for each POH classification with a marginal cost of 80% applied to Medicare costs to account for fixed costs unrelated to discharge volume.31 The reduction in Medicare revenues and costs was then applied to Medicaid, uncompensated care (UCC), and Commercial revenues and costs, after accounting for the payer mix of the POH type relative to the SCH. Please see the Appendix for more details about the analysis.
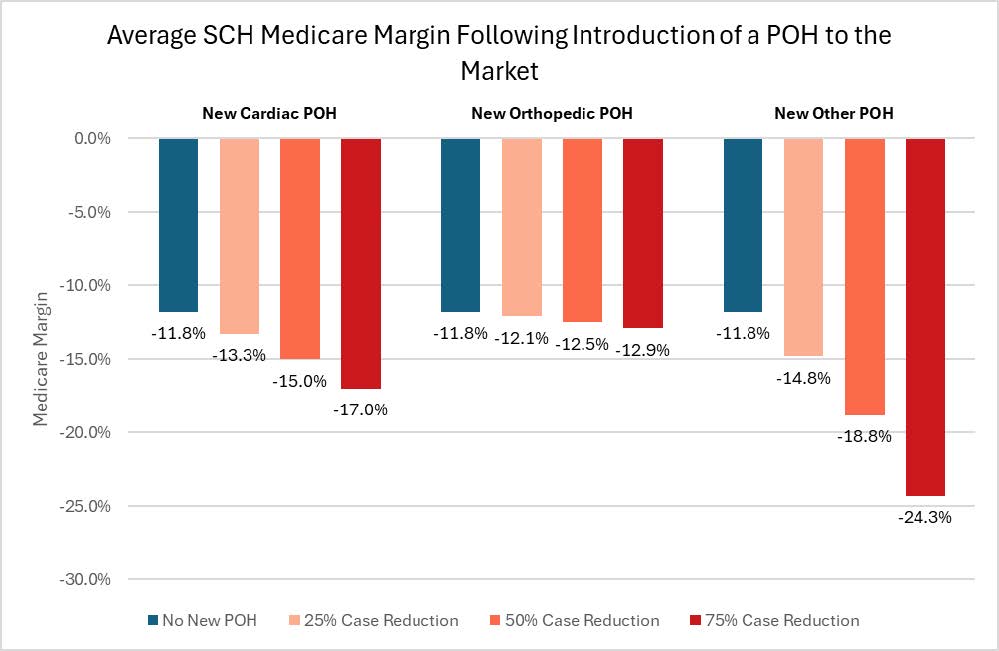
Three scenarios were modeled, representing a POH taking 25%, 50%, or 75% of the discharges from the DRGs and APCs identified as a core POH patient type for the specific POH classification. Exhibits 2 and 3 below show the impact on the average SCH’s overall and Medicare-specific margins following the introduction of a POH to the market.
Across all scenarios, the introduction of a POH into the market of the average SCH results in reduced margins, both Medicare-specific and overall. The extent of the decrease in the average SCH’s margin varies, depending on the scenario modeled.
Relative to the average SCH margin of 2.5% in the absence of a newly introduced POH, the entry of an orthopedic POH could result in reduced overall margins ranging from 2.1% (a 25% case reduction) to 1.2% (a 75% case reduction). This would represent a 16.8% to 53.7% decline in margins. The introduction of an ‘other’ POH could lower overall margins to 0.1% (25% case reduction) to -7.3% (75% case reduction), representing a 94.3% to 386.7% decline in margins. The introduction of a cardiac POH could result in overall margins ranging from 1.4% (25% case reduction) to -1.2% (75% case reduction), a decrease of 43.9% to 147.0%. In summary, the SCH overall margin is highly sensitive to the magnitude of volume loss, with greater reduction in case volume leading to negative overall margins in most scenarios.
Impacts on Medicare-specific margins show similar trends as the impacts on overall margin. Given that Medicare margins are already negative for SCHs, the introduction of a POH in the market would further exacerbate financial losses. The entry of an orthopedic POH results in the smallest decline, with Medicare margins decreasing by 2.8% at a 25% case reduction to 9.0% at a 75% case reduction. The entry of an ‘other’ POH results in the largest decrease in margin, with Medicare margins falling by 25.6% at a 25% case reduction and by 105.5% at a 75% case reduction. The entry of a cardiac POH results in Medicare margins decreasing by 12.8% at a 25% case reduction and by 44.0% at a 75% case reduction.
This analysis faced several limitations primarily related to data availability. Due to a lack of payment data for Medicare Advantage (MA) plans, the analysis assumed MA payment levels were the same as Fee-for-Service payment levels. If MA payment levels are lower than FFS payment levels, the margin estimates in this analysis may overestimate actual SCH margins.32 Further, there is no publicly available data on commercial discharges from SCHs, necessitating extrapolating findings from Medicare payment data to commercial payments. However, the payer mix adjustment to the revenue/cost reduction aims to reduce the impact of this limitation. Additionally, the three discharge reduction scenarios (25%/50%/75%) do not account for the capacity of a new POH to treat the cases removed from the SCH. The actual number of discharges shifting from the hypothetical SCH to a new POH could therefore be less or more than modeled, given that a new POH would be located more than 35 miles (or 15 miles in mountainous areas) from an existing hospital.
Our analysis suggests that the introduction of a POH into a rural market would have negative financial impacts on an existing SCH. Across all scenarios, the introduction of a POH in a rural market resulted in reduced overall and Medicare-specific margins for SCHs. Given the essential yet vulnerable position of SCHs in their communities, their reduced financial viability could have broader negative consequences on the health of the community’s patient population and economy.
The POHs used in this analysis were identified based primarily on a June 2016 Physician Hospitals of America list and subsequent FAH/AHA review. A subset of 141 of these 168 POHs were included in the analysis due to missing or aberrant cost report data. Using CY 2022 Medicare Fee-for-Service (FFS) claims and Medicare Advantage encounter data, DDA summarized the inpatient discharges of each POH by Major Diagnostic Category (MDC). Each POH was then classified as a cardiac, orthopedic, or other POH according to the MDC with the plurality of inpatient discharges and at least 35% of discharges for that POH. The POH-type classifications were mutually exclusive and were assigned as follows:
Medicare utilization was summarized by MS-DRG and by primary APC (APC with the highest relative payment weight on the claim) for each POH type in CY 2022 using Medicare FFS claims and Medicare Advantage encounter data. The top 75% of MS-DRGs and APCs by Medicare utilization for each POH type were then selected as the ‘high-usage’ MS-DRGs and APCs indicative of a cardiac, orthopedic, or other POH case mix. There were 39, 7, and 105 MS-DRGs and 7, 12, and 26 APCs assigned to cardiac, orthopedic and other POHs, respectively. These classifications were not mutually exclusive.
Medicare utilization by MS-DRG and APC for a hypothetical SCH was calculated as the average number of inpatient discharges by MS-DRG and outpatient claims by primary APC per hospital across all SCHs nationally in CY 2022. Inpatient discharges and outpatient claims were compiled for both Medicare FFS and Medicare Advantage beneficiaries. SCHs were identified using the Medicare IPPS Impact file for FY 2022 as hospitals with a provider type of 16 or 17.
Medicare revenues and costs by MS-DRG for a hypothetical SCH were calculated as the average Medicare FFS payment or cost per discharge across all SCHs nationally in CY 2022. Payments included total IPPS operating and capital payments as well as Medicare per-diem pass-thru payments (bad debt, direct medical education, and organ acquisition payments). The analysis assumes Medicare Advantage payment levels to be the same as Medicare FFS. Costs were calculated for each revenue center on the discharge claim by multiplying the revenue center charge by the hospital’s corresponding Ratio of Costs to Charges (RCC) which was calculated for each SCH from Medicare Hospital Cost Reports for FY 2022. These costs were summarized across all revenue centers to the claim level. The RCCs were calculated using Medicare Cost Report Worksheet C column 5 (costs) and the sum of columns 6 and 7 (charges). The costs in Worksheet C are specific to only revenue producing departments. These costs include each department’s direct labor costs and other direct costs as well as an allocation of overhead costs, and thus represents total hospital costs allocated only to revenue producing departments.
Medicare revenues and costs by primary APC for a hypothetical SCH were calculated as the average Medicare FFS payment or cost per outpatient hospital claim across all SCHs nationally in CY 2022. Total payments for all services provided on the claim plus outlier payments were included. The analysis assumes Medicare Advantage payment levels to be the same as Medicare FFS. Similarly, Medicare costs by primary APC for a hypothetical SCH was calculated as the average Medicare FFS cost per outpatient hospital claim across all SCHs nationally in CY 2022. Costs for outpatient claims were calculated for each revenue center on the claim by multiplying the revenue center charge by the hospital’s corresponding RCC which was calculated for each SCH from Medicare Hospital Cost Reports for FY 2022. These costs were summarized across all revenue centers to the claim level.
Revenues and costs for a Hypothetical SCH and each of the POH types were aggregated across the 421 SCHs and 141 POHs that met the following criteria:
The Medicare costs and revenues per MS-DRG and APC were used to estimate the impact of each POH type opening in the same market as an existing SCH. The Medicare revenues for the hypothetical SCH were reduced by 25%, 50%, or 75% for each MS-DRG or APC identified as a ‘core case type’ for the specific POH type. The Medicare costs were reduced by 80% of the 25%, 50%, or 75% reduction to account for various fixed costs unaffected by patient volume. This 20% reduction was selected based on Medicare’s outlier payment methodology.33
Following the reduction to Medicare revenues and costs for each MS-DRG and APC associated with a particular POH, the Medicaid, UCC, and commercial revenues and costs were reduced proportionally, such that a 20% reduction in Medicare revenues results in a 20% reduction in Medicaid, UCC, and commercial revenues. This reduction is then further modified by the ratio of payer mix between the POH type and the Hypothetical SCH. For instance, if a Cardiac POH had twice the relative Medicaid costs compared to the Hypothetical SCH, the reduction in Medicaid costs and revenues in the Cardiac POH scenario would be multiplied by a factor of two.
The overall impact of a POH opening in the same market as an existing SCH can be measured by the reduction in the overall margin as a result of the decline in revenues and costs.
| Scenario | 25% Reduction in Case Volume | 50% Reduction in Case Volume | 75% Reduction in Case Volume | |||
|---|---|---|---|---|---|---|
| Overall Margin | Percentage Point Change; Percent Change | Overall Margin | Percentage Point Change; Percent Change | Overall Margin | Percentage Point Change; Percent Change | |
| SCH with no POH | 2.5% | 2.5% | 2.5% | |||
| SCH with New Cardiac POH | 1.4% | -1.1%; -43.9% | 0.2% | -2.4%; -92.6% | -1.2% | -3.7%; -147.0% |
| SCH with New Orthopedic POH | 2.1% | -0.4%; -16.8% | 1.7% | -0.9%; -34.7% | 1.2% | -1.4%; -53.7% |
| SCH with New Other POH | 0.1% | -2.4%; -94.3% | -3.0% | -5.5%; -217.8% | -7.3% | -9.8%; -386.7% |
| Scenario | 25% Reduction in Case Volume | 50% Reduction in Case Volume | 75% Reduction in Case Volume | |||
|---|---|---|---|---|---|---|
| Medicare Margin | Percentage Point Change; Percent Change | Medicare Margin | Percentage Point Change; Percent Change | Medicare Margin | Percentage Point Change; Percent Change | |
| SCH with no POH | -11.8% | -11.8% | -11.8% | |||
| SCH with New Cardiac POH | -13.3% | -1.5%; -12.8% | -15.0% | -3.2%; -27.3% | -17.0% | -5.2%; -44.0% |
| SCH with New Orthopedic POH | -12.1% | -0.3%; -2.8% | -12.5% | -0.7%; -5.9% | -12.9% | -1.1%; -9.0% |
| SCH with New Other POH | -14.8% | -3.0%; -25.6% | -18.8% | -7.0%; -59.3% | -24.3% | -12.5%; -105.5% |