

Advisory
AHA Comments on MedPAC Payment Update Recommendations
January 9, 2026
Michael Chernew, Ph.D.
Chairman
Medicare Payment Advisory Commission
425 I Street, NW, Suite 701
Washington, D.C. 20001
Dear Dr. Chernew:
On behalf of our nearly 5,000 member hospitals, health systems and other health care organizations; our clinician partners — including more than 270,000 affiliated physicians, 2 million nurses and other caregivers — and the 43,000 health care leaders who belong to our professional membership groups, the American Hospital Association (AHA) respectfully requests that you consider the following issues before making your final payment update recommendations at the January Medicare Payment Advisory Commission (MedPAC) meeting.
The decisions you reach on hospital payment updates will affect not only America’s hospitals and health systems but also other providers and, most importantly, the patients and communities we serve. In response to discussions during the December 2025 meeting and the commission’s draft recommendations, we:
- Urge the commission to consider a higher update for the inpatient and outpatient prospective payment systems (PPSs), given the sustained and substantial negative Medicare margins hospitals continue to face.
- Urge the commission to recommend current-law updates for inpatient rehabilitation facilities (IRFs), skilled nursing facilities (SNFs) and home health (HH) agencies, given their pivotal role in providing access to care for Medicare beneficiaries.
- Encourage the commission to consider recommending a higher update to physician reimbursements, one that more fully accounts for the impact of inflation.
- Suggest that the commission more carefully examine the role that MA plays in enrollee access to care and providers’ financial stability.
Our detailed comments on these issues follow.
HOSPITAL PAYMENT UPDATE RECOMMENDATIONS
The AHA appreciates MedPAC’s thoughtful discussion of payments under the hospital inpatient and outpatient PPSs. Specifically, it found that hospitals’ fee-for-service (FFS) Medicare margins remained very low — negative 12.1% in fiscal year (FY) 2024. In addition, margins remained negative for even the commission’s small group of “relatively efficient hospitals.”
These findings are very similar to those from the past three years, when the commission recommended an update of current law plus at least 1%. As such, we are concerned that the commission discussed a draft payment recommendation to update payments by current law only. We cannot discern a reason for the shift when the underlying findings are so similar. Thus, we urge the commission to finalize a recommendation of at least current law plus 1%, as it has done the previous three years, given that hospitals continue to face additional years of substantially negative Medicare margins.
Medicare payments have remained far below the cost of providing care. Specifically, according to the MedPAC data book, the Medicare program has not fully covered the costs of serving Medicare patients since 2002 — a full 23 years ago (see Figure 1 below). On average, Medicare only pays 82 cents for each dollar hospitals spend providing care to Medicare beneficiaries.1 Notably, MedPAC projects that hospitals’ FFS Medicare margins will remain depressed at negative 10% in 2026, after already hitting negative double-digit margins for four straight years.2
FIGURE 1: Overall Hospital FFS Medicare Margin, FY 2001 through FY 2023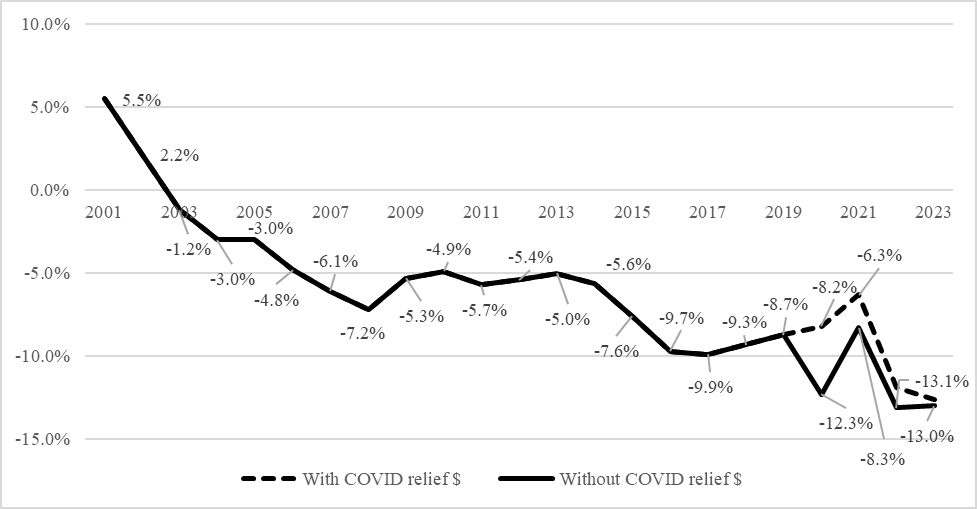 Source: MedPAC March Reports to Congress, 2003 - 2025
MedPAC’s draft recommendation of a current-law update only is inadequate given the ongoing unsustainable margins faced by hospitals and health systems. This is particularly true because current-law market-basket updates have continued to underestimate actual market-basket growth. Specifically, since the COVID-19 public health emergency, IHS Global Inc. (IGI) has under-forecasted actual market-basket growth by a total of 5.1 percentage points, as shown below.
Table 1: Inpatient PPS Market-Basket Updates, FY 2021 through FY 2024
Year | FY 2021 | FY 2022 | FY 2023 | FY 2024 | Total (Compounded) |
Market-Basket Update in Final Rule | 2.4% | 2.7% | 4.1% | 3.3% | 13.1% |
Actual/Updated Market-Basket Forecast | 3.0% | 5.7% | 4.8% | 3.6% | 18.2% |
Difference in Net Market-Basket Update and Actual Increase | -0.6% | -3.0% | -0.7% | -0.3% | -5.1% |
These missed forecasts have a significant and permanent impact on hospitals and health systems and the patients they care for. At current levels, this compounded underpayment of 5.1 percentage points totals a loss of approximately $5 billion annually. Further, future updates are based on current payment levels; therefore, these missed forecasts are permanently established in the standard payment rate for the inpatient and outpatient PPSs and will continue to compound.
Moreover, as we have discussed previously, high labor costs and increasing drug and supply costs have continued to strain hospital finances. In addition to direct costs of care, hospitals also have faced rising administrative costs and underpayments from MA plans. For example, the vast majority of MA plans require prior authorizations and also subject hospitals and other providers to high rates of authorization and payment denials, many of which require burdensome appeals to overturn. Hospitals and health systems spend substantial amounts of time and resources navigating these administrative hurdles imposed by private MA plans. A 2021 study by McKinsey estimated that hospitals spent $10 billion annually dealing with insurer prior authorizations alone.3 Making matters worse, MA plans paid hospitals less than 90% of Medicare rates despite costing taxpayers substantially more than traditional Medicare in 2023.4,5 In other words, the underpayment for beneficiaries enrolled in MA plans is even more dire than for those in the FFS program, something that is particularly striking in light of the additional costs the federal government incurs due to the program.
Hospitals will continue to face significant challenges in managing the gap between Medicare underpayments and rising costs as they strive to sustain high-quality services for their communities. These pressures are compounded by broader market factors, such as changes in health insurance coverage that may further increase the number of uninsured and growing expectations from states and employers to constrain spending. In some areas, hospitals have had to make difficult decisions about restructuring services or closing departments all together. We continue to urge the commission to ensure that Medicare payments more fully reflect the cost of providing care, supporting patients’ access to care and the long-term stability of hospital services.
POST-ACUTE CARE PAYMENT UPDATE RECOMMENDATIONS
IRFs. Also during the December meeting, MedPAC commissioners discussed recommending a 7% reduction to IRF PPS payments. We oppose this draft recommendation and urge MedPAC to instead support a current-law market-basket update for IRFs.
As MedPAC is aware, IRFs provide a distinct level of care, including an intensive and medically supervised course of rehabilitation for severely debilitated patients. Roughly 7 in 10 IRFs operate as units of short‑term acute‑care hospitals. As MedPAC noted, Medicare margins for IRF units are approximately 4%. This means that a cut of 7% would put their payments below the cost of providing care to Medicare beneficiaries. Applying such a large payment reduction would place stress on IRFs and the hospitals that support them, risking a loss of beneficiary access to medically necessary rehabilitation. Parent hospitals would face intensified strain as IRF beds and staff capacity shrink, forcing complex patients to remain on general inpatient floors longer or be discharged without appropriate post-acute placement. In addition to the strain on parent hospitals, other post‑acute providers may be tasked with caring for these patients with higher acuity and more complex medical needs than they routinely manage and may not be resourced to treat. This shift could compromise care and potentially increase overall costs to the Medicare program.
Hospital-based SNFs. Commissioners also considered a 4% reduction in SNF payments. The AHA is concerned with this proposal and urges MedPAC to support a current-law market-basket update for SNFs, especially for hospital-based SNFs.
As MedPAC is aware, hospitals have been grappling with longer inpatient lengths of stay and growing discharge delays, particularly for patients in need of post-acute care placement. Reducing SNF reimbursement would only intensify these bottlenecks, further exacerbating throughput challenges and patients’ ability to receive timely care. In addition, although hospital-based SNFs represent a small share of the field, these units shoulder an outsized role by routinely caring for medically complex, higher‑acuity patients while still maintaining strong quality performance.6 Yet, in recent years, hospital‑based SNFs have faced deeply negative Medicare margins — most recently of negative 40%. Further, MedPAC reports all-payer margins of only 2% for freestanding SNFs.7 Therefore, cuts of this magnitude by a significant payer like Medicare would pose significant financial strain for all SNFs, particularly hospital-based SNFs.
As is the case with other post-acute providers, if SNFs close or curtail services, hospitals would be forced to keep patients longer in the inpatient setting. Other providers, such as freestanding SNFs, HH agencies or outpatient clinics, may be asked to absorb additional patients that they may not be accustomed to treating. For these reasons, the AHA urges MedPAC to reconsider the draft reduction and support a current‑law market‑basket update for SNFs.
HH Agencies. The final recommendation considered by the commission was to reduce HH payments by 7%. The AHA is concerned by this reduction and urges MedPAC to support a current‑law market‑basket update for HH agencies. This is especially important for hospital-based HH agencies.
HH is an essential link in the care continuum. Approximately 1 in 5 hospitalized Medicare beneficiaries are discharged to HH, and these services enable safe, timely transitions from the inpatient setting to recovery at home. As mentioned with the other post-acute settings, and also detailed in the AHA’s recent comment letter, hospitals have had increasing difficulty placing patients with HH agencies. Along with other financial pressures, the continued application of budget neutrality adjustments, including the nearly 4% reduction applied for 2026, is straining HH agencies. As MedPAC notes, while Medicare FFS margins for HH agencies remain positive, all-payer margins are 5%.8 Further, hospital-based HH agencies have an FFS Medicare margin of negative 16.5%.
Reducing payments further would result in patients facing greater difficulty obtaining timely HH services, leading to prolonged inpatient stays, higher costs and reduced availability of acute care beds for other patients. For these reasons, the AHA urges MedPAC to recommend a current‑law market‑basket update for HH agencies. Doing so would help preserve adequate HH services, thereby stabilizing capacity, supporting safe transitions of care and protecting beneficiary access across the post‑acute continuum.
PHYSICIAN PAYMENT UPDATE RECOMMENDATIONS
The AHA appreciates the commission’s thoughtful presentation on assessing adequacy and updating payments for physician services. As highlighted in the presentation, there is a widening gap between physician fee schedule (PFS) updates and increases in the Medicare Economic Index (MEI), which threatens beneficiary access to care as well as provider financial stability. The AHA supports increasing physician payment rates outside of the parameters of budget neutrality, as the commission discussed. However, we urge MedPAC to recommend a higher update to physician payment rates, one which more fully reflects the impact of inflation.
Data from the American Medical Association indicate that physician payment has dropped by 33% since 2001 when accounting for inflation.9 As such, the commission’s draft recommendation to increase payment rates by 0.5% more than current law would not fully mitigate the impact of rising input costs. Indeed, as noted in the presentation, the draft recommendation would amount to an increase of 1.25% for clinicians who are qualifying alternative payment model participants (QPs) and 0.75% for clinicians who are not QPs. Yet the projected growth in MEI is 2.1% for CY 2027 alone. Moreover, when considering the 2.5% temporary increase that Congress enacted for CY 2026, the draft recommendation would result in a real payment cut to physicians.
We also urge MedPAC to again recommend that Congress establish safety-net add-on payments under the PFS for services furnished to low-income Medicare beneficiaries. Although the commission has consistently made this recommendation since 2023, it was not addressed during the December 2025 public meeting. Safety-net providers face particular challenges with remaining financially viable, and as such, we have supported MedPAC’s past recommendations. We refer you to our January 2023 letter for our views on the safety-net add-on payments recommendation.
IMPROVING MEDICARE PAYMENT APPROACHES
During the December 2025 meeting, the commission also discussed different approaches to improving the Medicare payment system. Recognizing that the Medicare program constitutes a growing share of the national gross domestic product, staff and commissioners discussed ways to improve the three main payment methods that exist in the Medicare program: FFS, alternative payment models and MA. We appreciate that the commission is interested in examining the incentives that exist in these three payment methods. In particular, we agree that the commission should assess MA plans’ incentives to balance efficiency with access to care, and we urge the commission to more carefully examine the role that MA plays in enrollee access to care and providers’ financial stability, as well as the increasing costs it incurs for the Medicare program.
MA has not delivered on its intent to reduce Medicare spending. MedPAC itself has stated that “issues with MA payment design have made it difficult for Medicare to realize savings from MA.”10 A recent report estimates that MA will be overpaid by $1.2 trillion between 2025-2034.11 MedPAC also has consistently found overpayments to MA plans, estimating that MA plans were paid in excess of $83 billion in 2024 alone.12 MA spending was found to be 22% higher than what FFS would have paid. Yet, at the same time, FFS Medicare margins have been in negative territory for two decades, as discussed above. MedPAC’s own analysis projects that Medicare’s average annual updates to payment rates will be -0.3% for Part A and -1.0% for Part B services from 2025-2034.13 As such, we believe that the true cost drivers of high spending growth in the Medicare program can be found by examining the MA program rather than FFS payments.
In fact, the Department of Health and Human Services found that “federal spending per person in MA has consistently exceeded per capita FFS Medicare spending since 2015 [and that] the differential has been growing and is projected to continue growing over time (italics added).”14 According to MedPAC’s own analysis, the spending difference can be attributed to coding intensity and favorable selection and not to differences in the amount of care provided to beneficiaries.15 For example, the top three commercial insurers, which account for over 50% of MA enrollment, have overbilled Medicare, according to the Department of Health and Human Services Office of the Inspector General.16 At the same time that federal spending for MA has increased, health insurance companies’ profits, as measured by their stock price, have hit record highs.17 Indeed, the AHA’s analysis on Medicare’s spending per beneficiary between MA and FFS shows this differential (see Figure 2 below). With estimates that CMS is expected to pay MA health insurance companies over $7 trillion over the next 10 years, we encourage the commission to take on a more critical analysis of MA’s role in Medicare’s spending growth and the value it purports to provide to Medicare beneficiaries. 18
FIGURE 2: Medicare Spending Per Beneficiary: FFS, MA, Part D
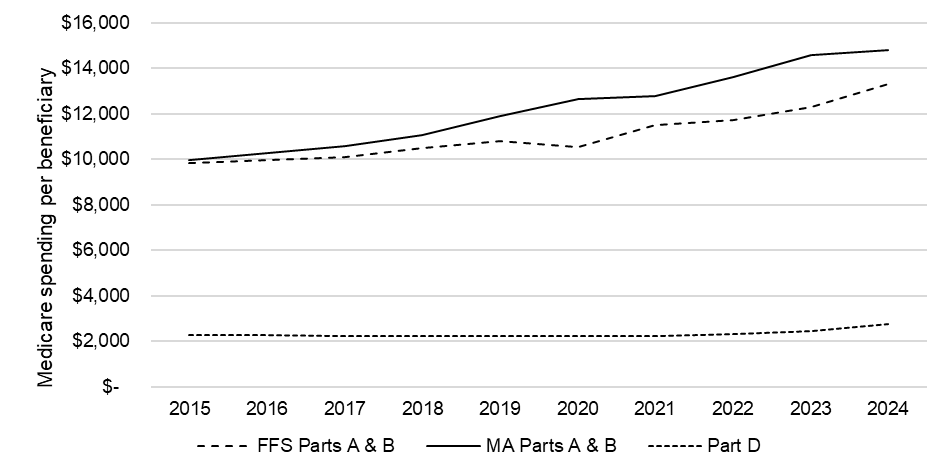
Source: AHA analysis of Medicare Trustees Report, 2025
While we agree with the commission that examining MA’s quality bonus program, risk adjustment methodology and benchmark calculations are worthwhile pursuits, we believe that more can be done within the MA program to slow down Medicare’s spending growth. First, MA administrative costs are higher than in FFS Medicare. Administrative spending in FFS Medicare is generally estimated to be 2% or less of program spending. In contrast, MA administrative spending includes marketing costs and broker commissions among other administrative costs.
Second, MA also drives up Medicare spending indirectly because of burdensome policies imposed by commercial health plans on health care providers. These policies include prior authorization requirements for a growing array of services, as well as step therapy or fail-first policies that delay patients from getting the most appropriate care, among other policies. Many hospitals and health systems are forced to dedicate staff and clinical resources to appeal and overturn inappropriate denials, which alone can cost billions of dollars every year. Recent data from Strata Decision Technology show that administrative costs now account for more than 40% of total expenses hospitals incur in delivering care to patients.19 And these challenges are compounded by the variability across multiple MA plans that providers may contract with.
Additionally, commercial insurers use post-payment claims audits to cut reimbursement to hospitals or otherwise unilaterally recoup payments after the fact. These unfair business practices create cash flow challenges for hospitals that threaten the viability of many community providers. An AHA survey from 2022 found that 50% of hospitals and health systems reported having more than $100 million in accounts receivable for claims that were older than six months.20 These claims added up to $6.4 billion in delayed or unpaid claims that were six months or older among the survey respondents.
MA is an important part of the Medicare program. Millions of Americans have chosen this approach to receiving Medicare coverage, and many more are expected to over the next decade. We urge you to carefully consider the role of MA in driving up Medicare spending in order to strengthen the program so that it works for patients and the providers who care for them.
We thank you for your consideration of our comments. Please contact me if you have questions or feel free to have a member of your team contact Shannon Wu, AHA director of policy, at swu@aha.org or 202-626-2963.
Sincerely,
/s/
Ashley B. Thompson
Senior Vice President
Public Policy Analysis and Development
Cc: Paul Masi, M.P.P.
MedPAC Commissioners
2 MedPAC cites negative double-digit margins for FYs 2022 and 2023. It also projects similar margins for FYs 2024 and 2025. MedPAC December 2025 Meeting. https://www.medpac.gov/wp-content/uploads/2025/01/Tab-D-Hospital-Dec-2025.pdf
Source: MedPAC March Reports to Congress, 2003 - 2025
3 McKinsey & Company. (2021). Administrative Simplification: How to Save a Quarter-Trillion Dollars in US Healthcare. https://www.mckinsey.com/~/media/mckinsey/industries/healthcare%20systems%20and%20services/our%20insights/administrative%20simplification%20how%20to%20save%20a%20quarter%20trillion%20dollars%20in%20us%20healthcare/administrative-simplification-how-to-save-a-quarter-trillion-dollars-in-us-healthcare.pdf
4 MedPAC (2021). MedPAC Report to Congress. https://www.medpac.gov/wp-content/uploads/import_data/scrape_files/docs/default-source/reports/mar21_medpac_report_to_the_congress_sec.pdf#page=401
5 Ensemble Health Partners. (2023). The Real Cost of Medicare Advantage Plan Success. https://www.ensemblehp.com/blog/the-real-cost-of-medicare-advantage-plan-success/
6 MedPAC (2025). MedPAC Report to Congress. https://www.medpac.gov/wp-content/uploads/2025/03/Mar25_Ch6_MedPAC_Report_To_Congress_SEC.pdf
7 MedPAC (2025). December meeting presentation. https://www.medpac.gov/wp-content/uploads/2025/01/Tab-F-SNF-update-Dec-2025.pdf
8 MedPAC (2025). December meeting presentation. https://www.medpac.gov/wp-content/uploads/2025/01/Tab-H-HHA-update-Dec-2025.pdf
10 MedPAC (2025). December meeting presentation. https://www.medpac.gov/wp-content/uploads/2025/01/Tab-K-Improving-Medicares-payment-approaches-Dec-2025.pdf
11 Committee for a Responsible Federal Budget, March 2025. “Medicare Advantage Will be Overpaid by $1.2 Trillion.” https://www.crfb.org/blogs/medicare-advantage-will-be-overpaid-12-trillion
12 MedPAC March Report to Congress 2024, https://www.medpac.gov/document/march-2024-report-to-the-congress-medicare-payment-policy/
13 This does not include inflation but does reflect Medicare’s annual updates to payment rates, total-factor productivity reductions, and any other reductions required by law or regulation.
14 HHS, ASPE (2023). “Medicare Advantage Overview: A Primer on Enrollment and Spending” https://aspe.hhs.gov/sites/default/files/documents/9b42ffbf2341726d5b63a9647b0aad15/medicare-advantage-overview.pdf
15 MedPAC March Report to Congress 2025, https://www.medpac.gov/wp-content/uploads/2025/03/Mar25_MedPAC_Report_To_Congress_SEC.pdf.
16 New York Times (2022), “’The Cash Monster was Insatiable’: How Insurers Exploited Medicare for Billions”: https://www.nytimes.com/2022/10/08/upshot/medicare-advantage-fraud-allegations.html.
17 E.g. UnitedHealth Group (UNH): https://finance.yahoo.com/quote/UNH/chart/; Humana (HUM): https://finance.yahoo.com/quote/HUM/chart/;
18 HHS, ASPE (2023). “Medicare Advantage Overview: A Primer on Enrollment and Spending” https://aspe.hhs.gov/sites/default/files/documents/9b42ffbf2341726d5b63a9647b0aad15/medicare-advantage-overview.pdf