

Advisory
Submitted to:
American Hospital Association
Federation of American Hospitals
Submitted by:
![]()
August 1, 2023
Dobson | DaVanzo recently examined Medicare claims data comparing demographic and clinical characteristics of facilities and patients receiving care at physician-owned hospitals (POHs) and all other acute care hospitals (non-POHs). That report showed that relative to POHs, non-POHs care for older, more medically complex patients who are on average burdened with multiple co-morbid conditions, while also operating on lower margins and providing more uncompensated and unreimbursed care. Building on this work, we now investigate to what extent differences exist among these hospital groups on their reporting and performance in Medicare’s Hospital Star Rating Domains and Hospital Readmissions Reduction Program (HRRP).1 This document outlines the data and methods used and summarizes preliminary findings.
The POHs represented in this fact sheet were identified based primarily on a June 2016 Physician Hospitals of America list and subsequent FAH/AHA review. Non-POHs are defined as the remaining acute care hospitals that are paid under the inpatient hospital prospective payment system (IPPS) defined under Section 1886(d) of the Social Security Act.2 For this analysis, market areas are defined as hospital referral regions (HRRs) from the Dartmouth Atlas of Healthcare, which are made up of zip code area groupings based on the referral patterns of tertiary medical care.3 Using data from the January 2023 Hospital General Information file and FY 2023 Hospital Readmissions Reduction Program (HRRP) Supplemental file produced by CMS, we conducted descriptive analyses to compare POHs with non-POHs in POH market areas. POH market areas are defined as any HRR with at least one POH.
As shown in Table 1 below, POHs generally reported fewer measures in each of the Hospital Compare Star Rating domains as compared to non-POHs in POH markets. The one exception is the Patient Experience domain, where POHs report a slightly higher average number of measures as compared to non-POHs in POH markets. This further demonstrates that POHs do not treat the same scope, complexity or acuity of patients compared to non-POHs.
| Hospital Group | Number of Hospitals | Average Count of Facility Mortality Measures | Average Count of Facility Safety Measures | Average Count of Facility Readmission Measures | Average Count of Facility Patient Experience Measures | Average Count of Facility Timely and Effective Care Measures |
|---|---|---|---|---|---|---|
| POH | 158 | 1.3 | 2.8 | 4.3 | 7.1 | 2.9 |
| Non-POHs in POH Markets | 1,184 | 4.6 | 5.0 | 7.7 | 7.0 | 6.4 |
| Total | 1,342 | 4.2 | 4.7 | 7.3 | 7.0 | 6.0 |
| % Difference (POH and Non-POH) | 111.7% | 55.4% | 56.1% | 2.6% | 75.4% |
Notes:
Non-acute care hospitals, hospitals that do not participate in in the Inpatient Quality Reporting (IQR) and Outpatient Quality Reporting (OQR) programs (identified via Hospital General Information file footnote 19), and Department of Defense hospitals are excluded.
Non-POH hospitals are restricted to those located in the same market as a POH (86 HRRs).
The count of facility measures was set to 0 for a facility's domain when the count of measures reported was 'not available' and CMS General information file footnote 5 ('Results are not available for this reporting period') was present.
Data shown are rounded to the nearest tenth decimal place. Percent difference is calculated from the unrounded POH and Non-POH average measure count data. Source: Dobson | DaVanzo analysis of 2023 Hospital General Information file produced by CMS.
Hospitals are organized into peer groups in the Hospital Readmissions Reduction Program to measure relative performance on HRRP measures among hospitals that are similarly situated. Congress mandated that CMS implement peer groups in the HRRP beginning on October 1, 2018 in order to account for the influence of health-related social needs on readmissions performance. Peer grouping is designed to facilitate more equitable performance comparisons and payment adjustments across hospitals in the HRRP. These peer groups are defined based on the proportion of a hospital’s care provided to patients who are dually-eligible for Medicare and Medicaid. Dual-eligible proportion is intended to serve as a proxy for the prevalence of health-related social needs among the patients that hospitals serve. Hospitals are peer grouped with other hospitals serving similar proportions of dual-eligible patients and have their readmissions measure performance compared to other hospitals within their peer group.
Based on an analysis of FY 2023 HRRP results, the majority of POHs fall into the lowest dual-eligible proportion peer group, which indicates that they treat smaller proportions of dual-eligible patients as compared to non-POHs. Additional detail is shown in Chart 1, below.
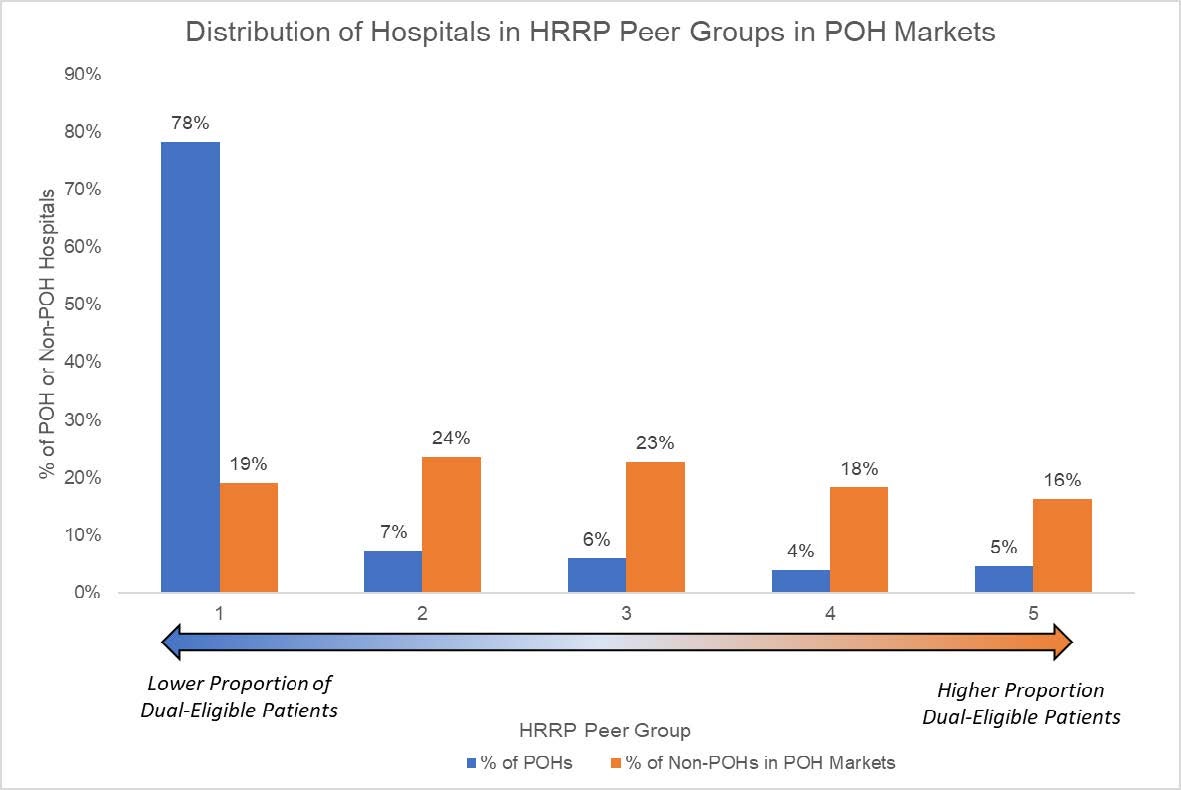
Source: Dobson | DaVanzo analysis of FY 2023 Hospital Readmissions Reduction Program (HRRP) Supplemental file produced by CMS.
This finding is consistent with our prior report showing that non-POHs competing with POHs treated 10.7% more dual-eligible patients relative to POHs. In addition, because POHs tend to specialize in selected medical conditions, only 1.3 of the 5 conditions4 on average have sufficient volume (25 cases or more) volume to qualify for the HRRP composite measure compared to an average of 3.5 conditions for non-POHs in the Lowest Dual-Eligible Proportion Peer Group. Although the HRRP composite metric consists of only specific conditions that POHs treat, they receive higher Medicare penalties than non-POHs that treat a broader set of conditions and are subjected to more conditions included in the HRRP composite measure. Additional detail is provided in the points and Table 2, below.
| Hospital Group | Number of Hospitals | Average HRRP Payment Reduction Percentage | Percent Hospitals with Max HRRP Penalty | Average Number of Conditions Eligible for HRRP Composite Measure |
|---|---|---|---|---|
| POHs | 119 | 0.4% | 6.7% | 1.3 |
| Non-POHs in POH Markets | 216 | 0.3% | 0.5% | 3.5 |
Notes:
POHs and non-POHs were stratified based on dual-eligibility peer group, which consists of five peer groups based on the hospital’s dual proportion.5
The HRRP measure is a composite metric that includes hospital excess readmission rates within five conditions/procedures.6
A hospital must have at least 25 Medicare discharges within condition/procedure for that condition/procedure to be included in the composite metric.
Source: Dobson | DaVanzo analysis of FY 2023 Hospital Readmissions Reduction Program (HRRP) Supplemental file produced by CMS.
As compared to non-POHs in the same market as a POH, POHs appear to report fewer measures in most of the CMS Hospital Compare Star Ratings Domains and are less likely to have adequate volume to qualify for the full breadth of HRRP measures. This suggests POHs are accountable for a narrower scope of quality measure performance than non-POHs. POHs have sometimes asserted that offering more focused services facilitates stronger quality performance. Yet, this analysis shows POHs appear to have slightly higher average readmission penalties. POHs also are disproportionately more likely than similarly situated non-POH hospitals to experience the maximum HRRP penalty. These findings build on our prior work that shows POHs care for a less medically complex Medicare population than non-POHs./p>