

Medicaid Spending Reductions Would Lead to Losses in Jobs, Economic Activity and Tax Revenue for States
Medicaid is the nation’s largest single source of coverage, providing access to care for 72 million Americans. It primarily serves low-income populations — children and their families, adults, seniors and disabled individuals. Almost half of adults in poverty, nearly 4 in 10 children, and over 60% of nursing home residents are covered by Medicaid. And, for over 12 million dually eligible Medicare-Medicaid enrollees, Medicaid helps with premiums and cost sharing, as well as provides long-term care services. The program provides a broad array of health care services, such as primary and acute care services, as well as long-term services and supports.
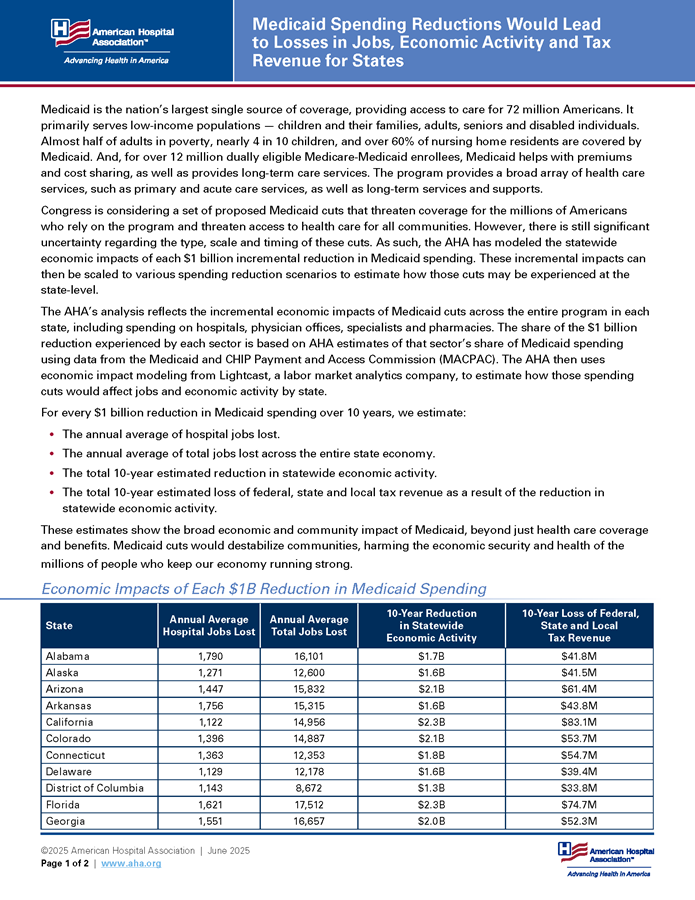
Congress is considering a set of proposed Medicaid cuts that threaten coverage for the millions of Americans who rely on the program and threaten access to health care for all communities. However, there is still significant uncertainty regarding the type, scale and timing of these cuts. As such, the AHA has modeled the statewide economic impacts of each $1 billion incremental reduction in Medicaid spending. These incremental impacts can then be scaled to various spending reduction scenarios to estimate how those cuts may be experienced at the state-level.
The AHA’s analysis reflects the incremental economic impacts of Medicaid cuts across the entire program in each state, including spending on hospitals, physician offices, specialists and pharmacies. The share of the $1 billion reduction experienced by each sector is based on AHA estimates of that sector’s share of Medicaid spending using data from the Medicaid and CHIP Payment and Access Commission (MACPAC). The AHA then uses economic impact modeling from Lightcast, a labor market analytics company, to estimate how those spending cuts would affect jobs and economic activity by state.
For every $1 billion reduction in Medicaid spending over 10 years, we estimate:
- The annual average of hospital jobs lost.
- The annual average of total jobs lost across the entire state economy.
- The total 10-year estimated reduction in statewide economic activity.
- The total 10-year estimated loss of federal, state and local tax revenue as a result of the reduction in statewide economic activity.
These estimates show the broad economic and community impact of Medicaid, beyond just health care coverage and benefits. Medicaid cuts would destabilize communities, harming the economic security and health of the millions of people who keep our economy running strong.
Economic Impacts of Each $1B Reduction in Medicaid Spending*
| State | Annual Average Hospital Jobs Lost | Annual Average Total Jobs Lost | 10-Year Reduction in Statewide Economic Activity | 10-Year Loss of Federal, State and Local Tax Revenue |
|---|---|---|---|---|
| Alabama | 1,790 | 16,101 | $1.7B | $41.8M |
| Alaska | 1,271 | 12,600 | $1.6B | $41.5M |
| Arizona | 1,447 | 15,832 | $2.1B | $61.4M |
| Arkansas | 1,756 | 15,315 | $1.6B | $43.8M |
| California | 1,122 | 14,956 | $2.3B | $83.1M |
| Colorado | 1,396 | 14,887 | $2.1B | $53.7M |
| Connecticut | 1,363 | 12,353 | $1.8B | $54.7M |
| Delaware | 1,129 | 12,178 | $1.6B | $39.4M |
| District of Columbia | 1,143 | 8,672 | $1.3B | $33.8M |
| Florida | 1,621 | 17,512 | $2.3B | $74.7M |
| Georgia | 1,551 | 16,657 | $2.0B | $52.3M |
| Hawaii | 1,316 | 14,354 | $1.8B | $70.1M |
| Idaho | 1,404 | 15,467 | $1.7B | $40.9M |
| Illinois | 1,455 | 15,307 | $2.0B | $71.6M |
| Indiana | 1,573 | 14,191 | $1.7B | $40.8M |
| Iowa | 1,584 | 14,321 | $1.6B | $41.0M |
| Kansas | 1,640 | 15,071 | $1.7B | $43.5M |
| Kentucky | 1,678 | 13,964 | $1.6B | $38.7M |
| Louisiana | 1,595 | 16,767 | $1.7B | $50.7M |
| Maine | 1,439 | 13,403 | $1.7B | $62.0M |
| Maryland | 1,444 | 13,074 | $1.7B | $55.4M |
| Massachusetts | 1,302 | 12,816 | $1.9B | $50.5M |
| Michigan | 1,571 | 15,865 | $1.9B | $53.6M |
| Minnesota | 1,455 | 14,733 | $2.0B | $56.9M |
| Mississippi | 1,715 | 15,970 | $1.5B | $44.9M |
| Missouri | 1,490 | 15,088 | $1.8B | $43.2M |
| Montana | 1,580 | 14,837 | $1.7B | $33.4M |
| Nebraska | 1,537 | 13,966 | $1.7B | $46.5M |
| Nevada | 1,371 | 14,717 | $1.8B | $52.6M |
| New Hampshire | 1,528 | 12,344 | $1.7B | $43.0M |
| New Jersey | 1,367 | 12,946 | $1.8B | $68.7M |
| New Mexico | 1,380 | 14,632 | $1.6B | $56.9M |
| New York | 1,159 | 12,131 | $1.9B | $67.6M |
| North Carolina | 1,544 | 15,994 | $1.9B | $50.3M |
| North Dakota | 1,555 | 13,250 | $1.5B | $38.3M |
| Ohio | 1,564 | 15,167 | $1.9B | $55.7M |
| Oklahoma | 1,600 | 16,216 | $1.7B | $37.7M |
| Oregon | 1,259 | 13,892 | $1.8B | $49.4M |
| Pennsylvania | 1,562 | 13,352 | $1.8B | $53.6M |
| Rhode Island | 1,587 | 13,101 | $1.7B | $58.9M |
| South Carolina | 1,551 | 15,757 | $1.7B | $52.0M |
| uth Dakota | 1,531 | 13,167 | $1.6B | $39.2M |
| Tennessee | 1,463 | 14,486 | $1.8B | $51.3M |
| Texas | 1,506 | 18,178 | $2.2B | $60.3M |
| Utah | 1,487 | 15,838 | $1.9B | $49.3M |
| Vermont | 1,498 | 13,125 | $1.6B | $56.1M |
| Virginia | 1,410 | 13,732 | $1.7B | $52.5M |
| Washington | 1,153 | 12,659 | $1.9B | $77.1M |
| West Virginia | 1,525 | 13,602 | $1.4B | $31.4M |
| Wisconsin | 1,615 | 15,026 | $1.8B | $50.1M |
| Wyoming | 1,462 | 13,772 | $1.4B | $33.5M |
Sources: Economic impact modeling conducted by AHA using Lightcast (lightcast.io), as of May 2025, Total Medicaid Benefit Spending by State and Category from MACPAC, and sector employment levels from the North American Industry Classification System (NAICS).
* This analysis reflects the incremental economic impacts of each $1B reduction in Medicaid spending across all industries. The share of the $1B reduction experienced by each sector is based on AHA estimates of that sector’s share of Medicaid spending using data from MACPAC. These incremental impacts can be applied to Medicaid spending reductions across the 2026-2035 period. Total jobs lost are a result of the reduction in statewide economic activity; for example, this would include jobs lost because of less hospital spending and higher hospital unemployment resulting in lower economic activity such as buying goods and services. The loss of tax revenue includes reductions in state and local general sales and property taxes.
