

Case Studies
Delta, Omicron Surges Have Made Up About 50% of Total COVID-19 Hospital Admissions – No Provider Relief Funds Have Been Allocated to Address Many Challenges Resulting from These Surges
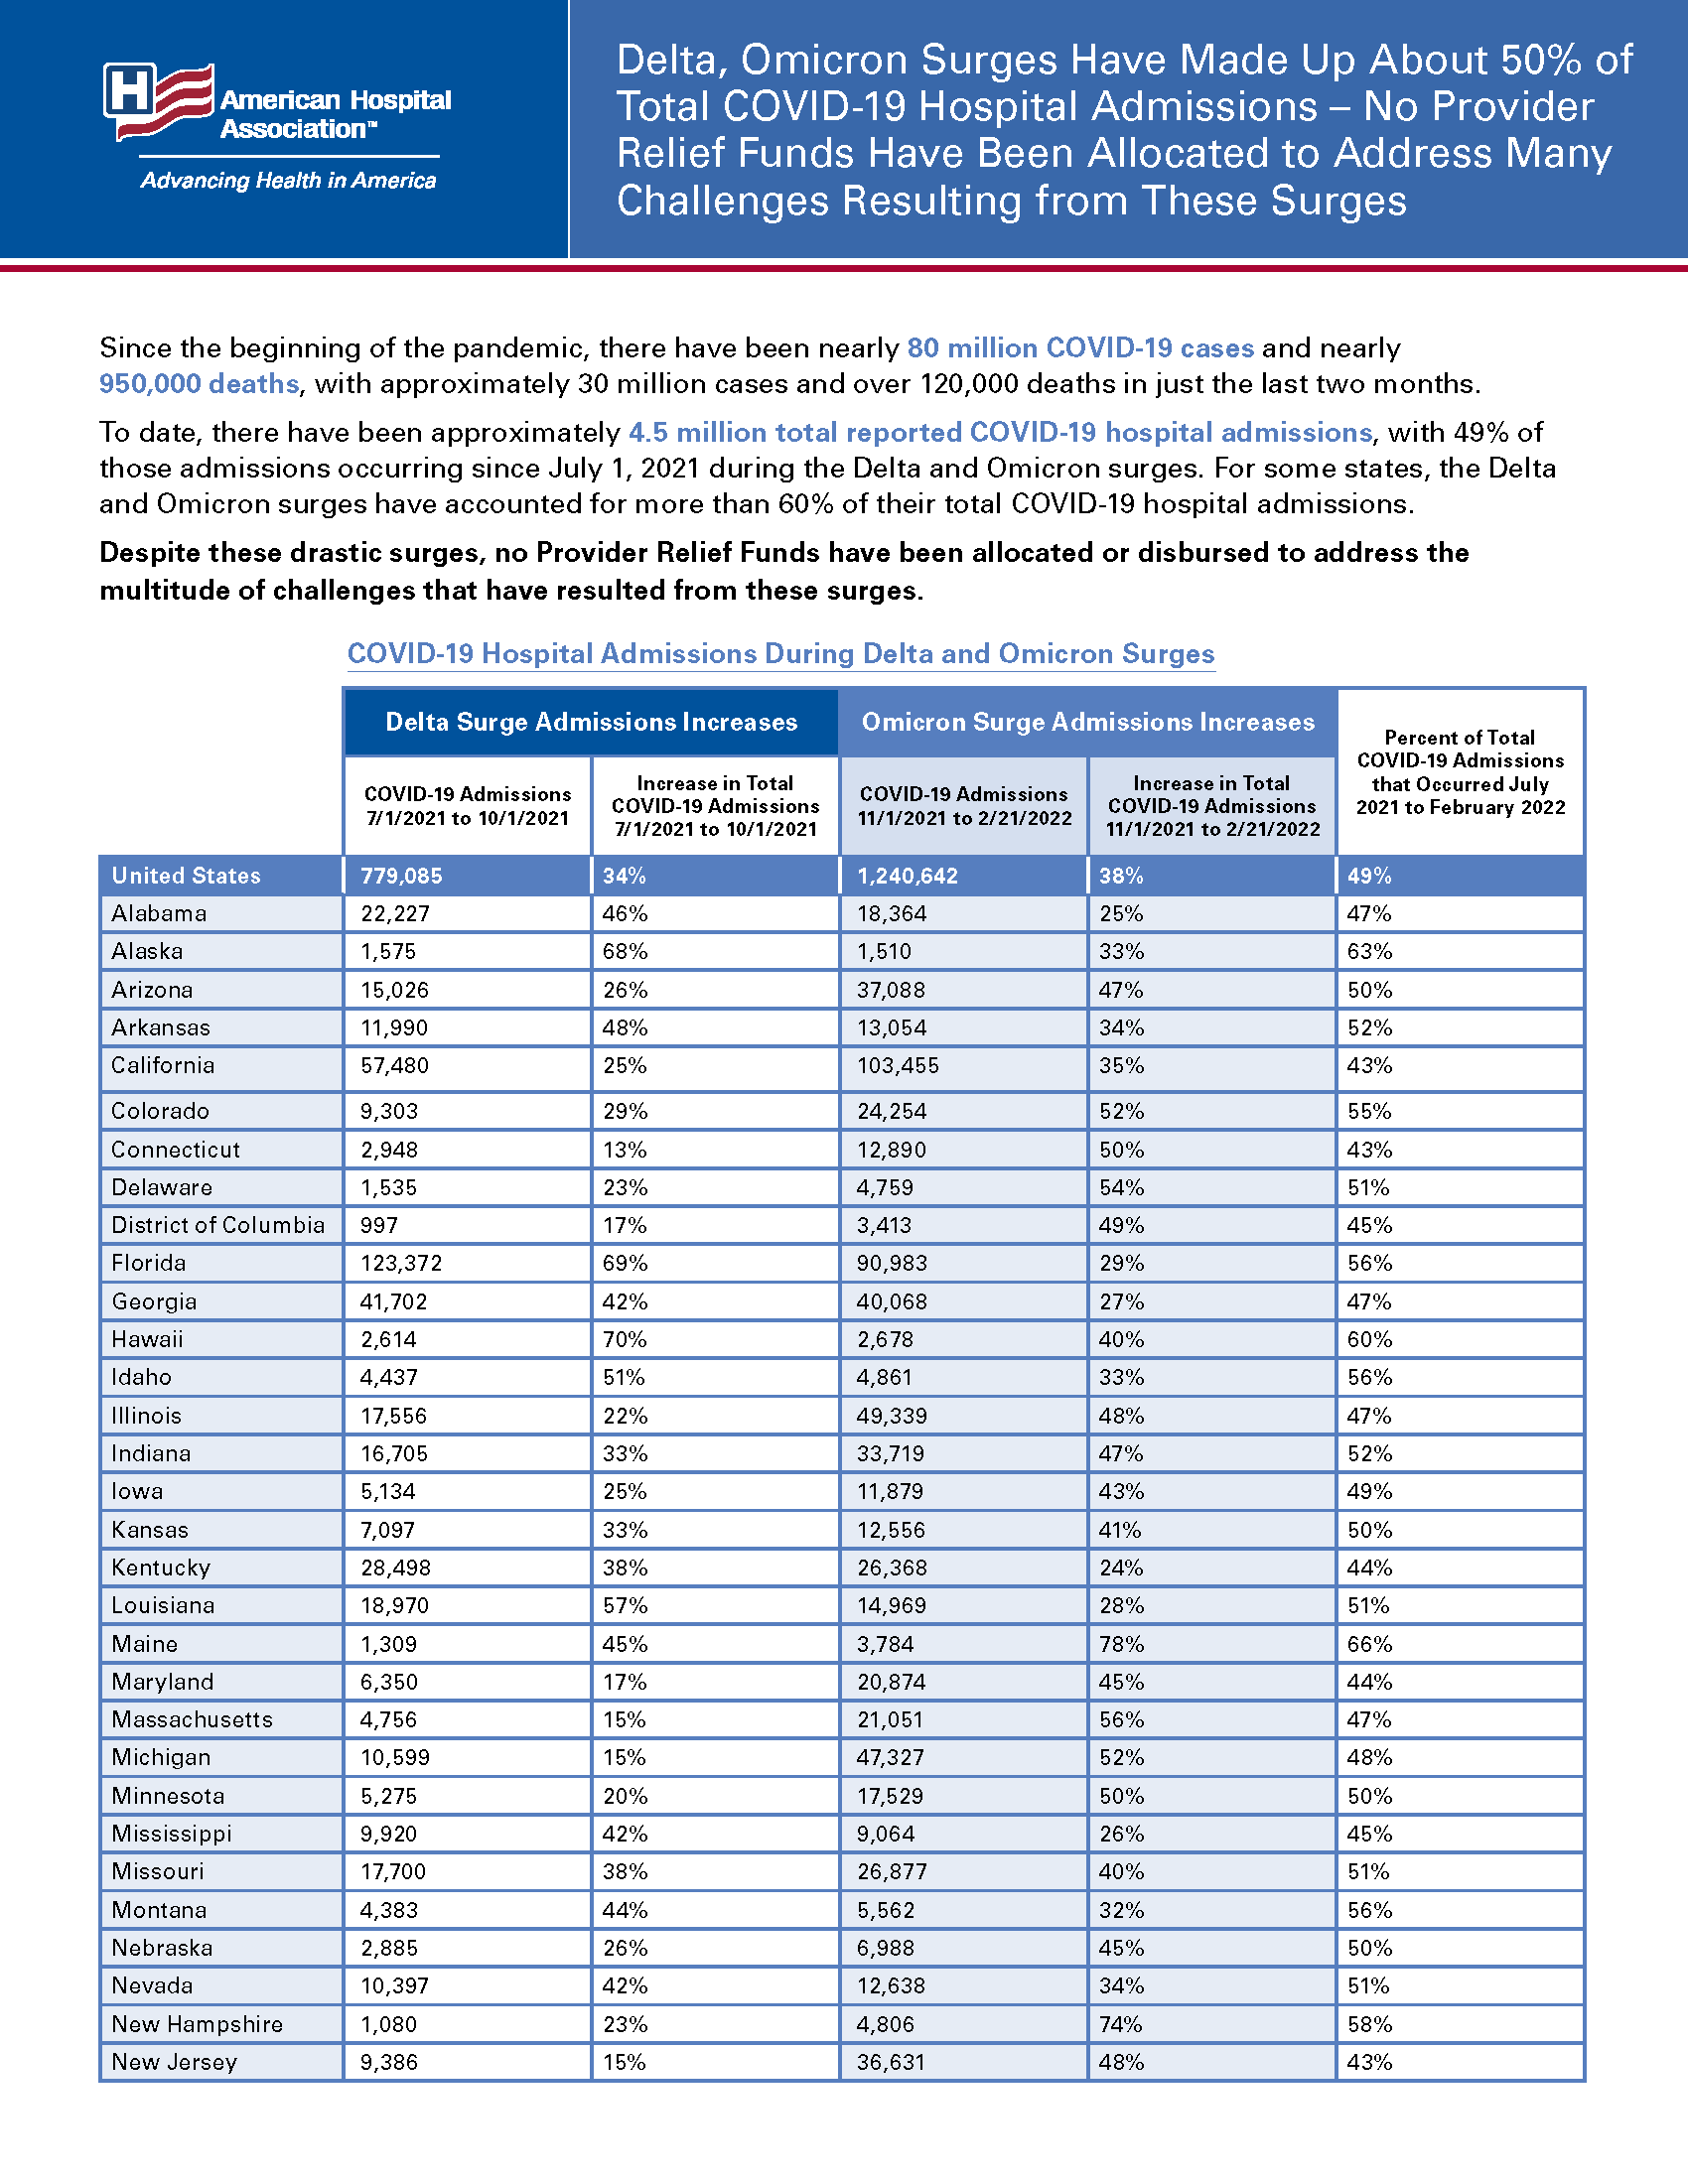
Since the beginning of the pandemic, there have been nearly 80 million COVID-19 cases and nearly 950,000 deaths, with approximately 30 million cases and over 120,000 deaths in just the last two months. To date, there have been approximately 4.5 million total reported COVID-19 hospital admissions, with 49% of those admissions occurring since July 1, 2021 during the Delta and Omicron surges. For some states, the Delta and Omicron surges have accounted for more than 60% of their total COVID-19 hospital admissions.
Despite these drastic surges, no Provider Relief Funds have been allocated or disbursed to address the multitude of challenges that have resulted from these surges.
| Delta Surge Admissions Increases | Omicron Surge Admissions Increases | Percent of Total COVID-19 Admissions that Occurred July 2021 to February 2022 | |||
|---|---|---|---|---|---|
| COVID-19 Admissions 7/1/2021 to 10/1/2021 | Increase in Total COVID-19 Admissions 7/1/2021 to 10/1/2021 | COVID-19 Admissions 11/1/2021 to 2/21/2022 | Increase in Total COVID-19 Admissions 11/1/2021 to 2/21/2022 | ||
| United States | 779,085 | 34% | 1,240,642 | 38% | 49% |
| Alabama | 22,227 | 46% | 18,364 | 25% | 47% |
| Alaska | 1,575 | 68% | 1,510 | 33% | 63% |
| Arizona | 15,026 | 26% | 37,088 | 47% | 50% |
| Arkansas | 11,990 | 48% | 13,054 | 34% | 52% |
| California | 57,480 | 25% | 103,455 | 35% | 43% |
| Colorado | 9,303 | 29% | 24,254 | 52% | 55% |
| Connecticut | 2,948 | 13% | 12,890 | 50% | 43% |
| Delaware | 1,535 | 23% | 4,759 | 54% | 51% |
| District of Columbia | 997 | 17% | 3,413 | 49% | 45% |
| Florida | 123,372 | 69% | 90,983 | 29% | 56% |
| Georgia | 41,702 | 42% | 40,068 | 27% | 47% |
| Hawaii | 2,614 | 70% | 2,678 | 40% | 60% |
| Idaho | 4,437 | 51% | 4,861 | 33% | 56% |
| Illinois | 17,556 | 22% | 49,339 | 48% | 47% |
| Indiana | 16,705 | 33% | 33,719 | 47% | 52% |
| Iowa | 5,134 | 25% | 11,879 | 43% | 49% |
| Kansas | 7,097 | 33% | 12,556 | 41% | 50% |
| Kentucky | 28,498 | 38% | 26,368 | 24% | 44% |
| Louisiana | 18,970 | 57% | 14,969 | 28% | 51% |
| Maine | 1,309 | 45% | 3,784 | 78% | 66% |
| Maryland | 6,350 | 17% | 20,874 | 45% | 44% |
| Massachusetts | 4,756 | 15% | 21,051 | 56% | 47% |
| Michigan | 10,599 | 15% | 47,327 | 52% | 48% |
| Minnesota | 5,275 | 20% | 17,529 | 50% | 50% |
| Mississippi | 9,920 | 42% | 9,064 | 26% | 45% |
| Missouri | 17,700 | 38% | 26,877 | 40% | 51% |
| Montana | 4,383 | 44% | 5,562 | 32% | 56% |
| Nebraska | 2,885 | 26% | 6,988 | 45% | 50% |
| Nevada | 10,397 | 42% | 12,638 | 34% | 51% |
| New Hampshire | 1,080 | 23% | 4,806 | 74% | 58% |
| New Jersey | 9,386 | 15% | 36,631 | 48% | 43% |
| New Mexico | 3,733 | 24% | 8,304 | 40% | 47% |
| New York | 19,115 | 15% | 77,883 | 49% | 44% |
| North Carolina | 22,707 | 39% | 33,633 | 39% | 51% |
| North Dakota | 1,271 | 22% | 3,145 | 40% | 49% |
| Ohio | 24,805 | 28% | 65,359 | 53% | 54% |
| Oklahoma | 18,967 | 41% | 21,884 | 32% | 49% |
| Oregon | 6,856 | 65% | 7,868 | 41% | 61% |
| Pennsylvania | 15,348 | 17% | 57,157 | 49% | 48% |
| Rhode Island | 735 | 16% | 3,009 | 54% | 46% |
| South Carolina | 17,121 | 53% | 18,556 | 36% | 55% |
| South Dakota | 1,590 | 21% | 4,372 | 44% | 47% |
| Tennessee | 21,388 | 42% | 23,488 | 31% | 49% |
| Texas | 105,009 | 44% | 104,083 | 29% | 48% |
| Utah | 5,781 | 39% | 10,571 | 46% | 56% |
| Vermont | 406 | 36% | 1,527 | 87% | 66% |
| Virginia | 11,990 | 30% | 26,098 | 47% | 51% |
| Washington | 9,993 | 54% | 15,272 | 48% | 60% |
| West Virginia | 5,283 | 44% | 9,286 | 48% | 58% |
| Wisconsin | 11,690 | 23% | 27,779 | 41% | 47% |
| Wyoming | 2,091 | 53% | 2,030 | 29% | 57% |
Source: CDC COVID Data Tracker, Total Admissions of Patients with Confirmed COVID-19
Includes data for new COVID-19 admissions starting August 1, 2020 from the Unified Hospital Dataset, White House COVID-19 Team. Data prior to August 1, 2020 are unavailable.
https://covid.cdc.gov/covid-data-tracker/#new-hospital-admissions