

Award
![]()
![]()
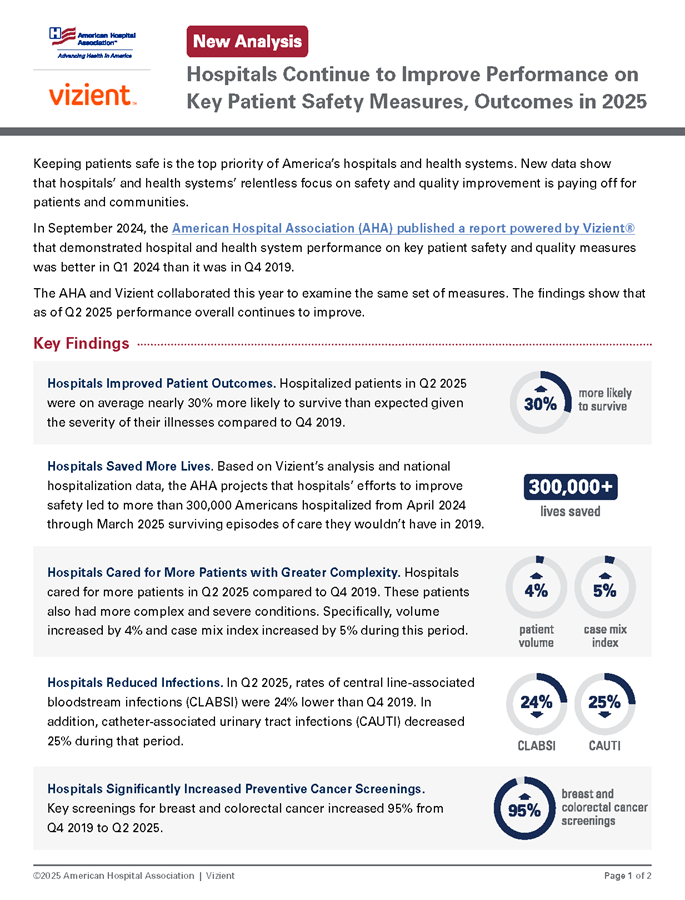
New Analysis
Keeping patients safe is the top priority of America’s hospitals and health systems. New data show that hospitals’ and health systems’ relentless focus on safety and quality improvement is paying off for patients and communities.
In September 2024, the American Hospital Association (AHA) published a report powered by Vizient® that demonstrated hospital and health system performance on key patient safety and quality measures was better in Q1 2024 than it was in Q4 2019.
The AHA and Vizient collaborated this year to examine the same set of measures. The findings show that as of Q2 2025 performance overall continues to improve.
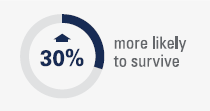 Hospitals Improved Patient Outcomes
Hospitalized patients in Q2 2025 were on average nearly 30% more likely to survive than expected given the severity of their illnesses compared to Q4 2019.
 Hospitals Saved More Lives
Based on Vizient’s analysis and national hospitalization data, the AHA projects that hospitals’ efforts to improve safety led to more than 300,000 Americans hospitalized from April 2024 through March 2025 surviving episodes of care they wouldn’t have in 2019.
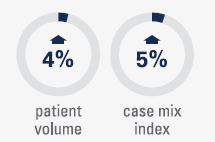 Hospitals Cared for More Patients with Greater Complexity
Hospitals cared for more patients in Q2 2025 compared to Q4 2019. These patients also had more complex and severe conditions. Specifically, volume increased by 4% and case mix index increased by 5% during this period.
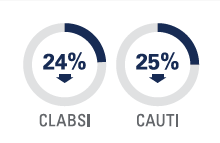 Hospitals Reduced Infections
In Q2 2025, rates of central line-associated bloodstream infections (CLABSI) were 24% lower than Q4 2019. In addition, catheter-associated urinary tract infections (CAUTI) decreased 25% during that period.
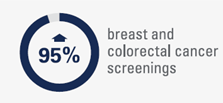 Hospitals Significantly Increased Preventive Cancer Screenings
Key screenings for breast and colorectal cancer increased 95% from Q4 2019 to Q2 2025.
Hospitals and health systems work every day to advance patient safety and quality of care. This report reflects the strength of a long-standing commitment and highlights the continued dedication of hospital teams nationwide to improving care and outcomes for the patients and communities they serve. The AHA continues to support hospitals and health systems in these efforts by sharing strategies, innovations and best practices that drive continued improvements. Visit AHA’s Patient Safety Initiative webpage for resources and examples of programs that hospitals and health systems across the country have implemented to advance quality and safety.
To produce this report, AHA partnered with Vizient, an independent, third-party, multi-faceted organization that supports hospitals and health systems in their efforts to efficiently deliver high quality care.
The primary analyses were entirely performed by Vizient team members and were powered by data from hospitals that routinely report clinical information to the Vizient Clinical Data Base (CDB). The CDB contains information on more than 1,300 hospitals, submitted within 30 days prior to the end of each quarter. This provides real-time feedback to the participating hospitals and allows them to benchmark their performance against that of other general, acute care hospitals. Data from the Vizient Clinical Data Base was used with permission of Vizient, Inc. All rights reserved. The report is available on AHA’s and Vizient’s websites.
Vizient receives data on more than 10 million inpatients and 180 million outpatients annually. To analyze the trends from pre-pandemic through Q2 2025, Vizient identified a cohort of 705 general, acute care hospitals for which it had a complete dataset from Q4 2019 through Q2 2025. These hospitals represent the wide spectrum of hospitals across 49 states and the District of Columbia, and range in size from approximately 20 beds to over 1,500 beds, including the ranges outlined below in Table 1. Of note, 10 hospitals analyzed in the original September 2024 cohort were not eligible for inclusion in this follow-up analysis.
| Comprehensive Academic Medical Center | 16% |
| Large, Specialized Complex Care Medical Center | 21% |
| Complex Care Medical Center | 23% |
| Community Hospital | 41% |
*Percentages do not add up to 100% due to rounding.