


Advancing Health Podcast
March 2026
 Introduction
America’s hospitals and health systems are the backbone of the U.S. health care system, providing 24/7 care to patients and communities. Hospital care today is more advanced, more effective and more resource-intensive than ever, reflecting major gains in medical innovation, as well as the highly skilled workforce, technology and infrastructure required to deliver it. Patients are living longer, recovering faster and receiving treatments that would have been unimaginable just a generation ago.
But those advances require substantial and sustained investment, and hospitals are delivering them in an environment marked by growing patient complexity, persistent workforce shortages and misalignments in how care is financed and paid for, making the cost of hospital care inseparable from the skilled people, technology, medicines and supplies needed to care for an older, sicker population.
Hospitals are unique within the health care sector because they support a wide spectrum of services — emergency care, inpatient treatment, surgery, diagnostics — all operating simultaneously. They bear substantial fixed costs to maintain specialized, high‑cost equipment and a fully staffed, 24/7 care environment that remains ready for anything, including disasters and large‑scale emergencies. This readiness requires extra training, resources, and surge capacity that other providers do not maintain.
An aging population and the increasing prevalence of chronic disease continue to raise the level of complexity and intensity of hospital care. At the same time, advances in medicine have enabled more routine and lower-acuity care to move to outpatient settings, leaving hospitals to care for an inpatient population with greater clinical and resource needs. Together, these shifts have created a new normal in which many hospitals are treating a greater share of patients requiring intensive services, specialized staffing and around-the-clock capacity.
Hospitals also are facing rapid growth in the cost of medical supplies, equipment and prescription drugs. Advances in medical innovation have transformed care, but they often arrive with high and rising price tags. Hospitals are uniquely exposed to these “pass through” costs to patients because many high-cost therapies are administered in hospitals and hospital outpatient settings. Layered on top of these clinical pressures are growing administrative burdens and payment friction, including prior authorization requirements, claims denials, and delayed payments, which increase costs without improving patient outcomes. Finally, these pressures are compounded by chronic underpayment from public programs and the necessity to maintain essential, around-the-clock services that often operate at low or negative margins.
This Costs of Caring report provides a data-driven assessment of these realities and underscores why sustainable affordability solutions must address the structural drivers of cost growth rather than focusing narrowly on hospital prices alone.
 Hospitals continue to face broad-based expense growth driven by a combination of workforce pressures, higher input costs — especially for drugs and supplies — and rising patient volume and acuity. In 2025, inpatient volumes increased by 5.3%, meaning hospitals were caring for more patients who are increasingly sicker, even as they sustained essential, around-the-clock services — many of which do not fully cover their costs — that communities rely on. In addition, benchmark data show outpatient visits rising in 2025 (up 9.8% year over year), reflecting both higher demand and the ongoing shift of care to outpatient and ambulatory settings.
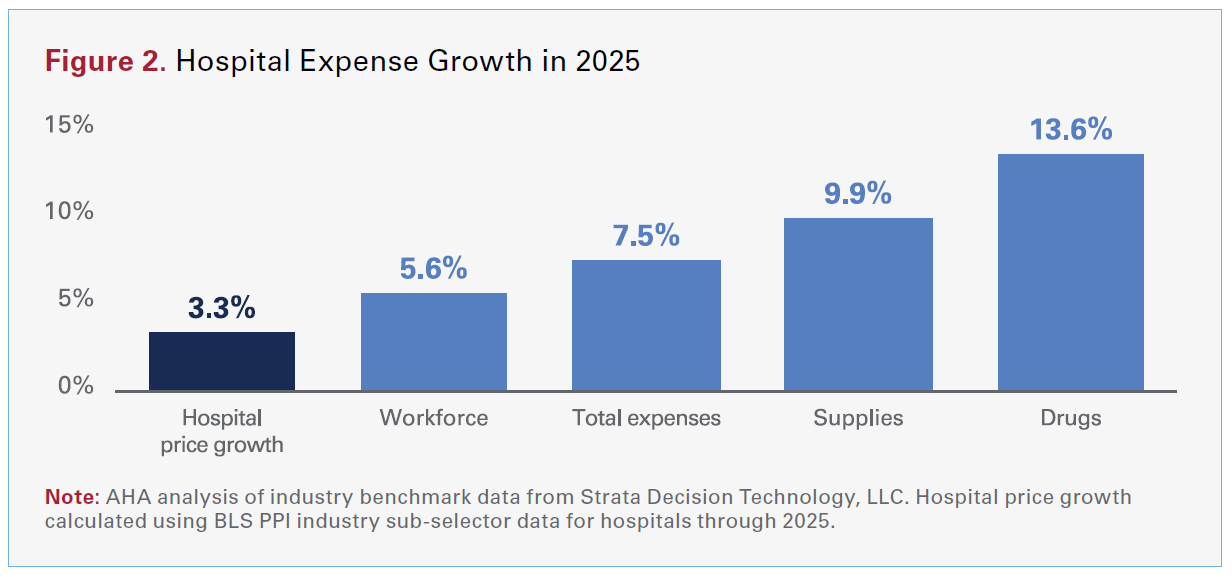
As shown in Figure 2, hospital expenses have continued to climb. Industry benchmark data from Strata Decision Technology, LLC indicate that in 2025, total hospital expenses grew 7.5% — more than twice the rate of growth in hospital prices over the same period — with growth across every major category. In fact, hospital spending on drugs was four times higher than the growth in hospital prices. That gap reflects a simple reality: Hospitals are delivering more care to patients who are increasingly medically complex, while the key inputs of care — labor, drugs and supplies — are getting more expensive.
Hospital care has accounted for roughly one third of total national health expenditures (NHE) for decades and has remained below that level since the early 2000s. As a share of total health spending, hospital spending today is essentially unchanged from where it was 30 years ago and well below where it was in the 1980s.1,2
Hospitals are not only paying more to provide care, they also are delivering more care to patients who are sicker and more medically complex. A recent AHA/Vizient analysis found that hospital case-mix index — a standard measure of how sick patients are — rose by about 5% between 2019 and 2024, indicating that a larger share of hospital care is devoted to higher-acuity patients with multiple conditions, greater clinical needs and longer stays. The continued rising prevalence of chronic diseases, such as heart disease, cancer and liver disease, continues to beset the system.
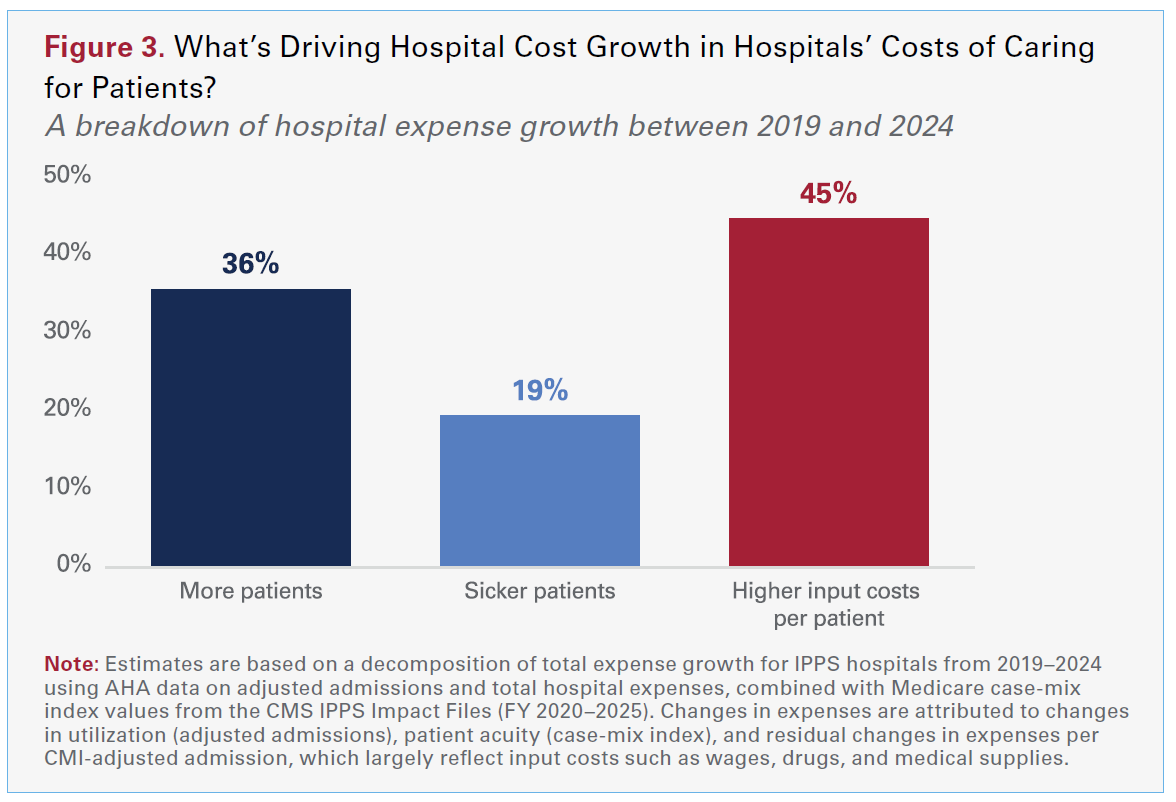
Using AHA annual survey data, we estimate that from 2019 to 2024, roughly 36% of hospital cost growth reflects treating more patients — more admissions, more outpatient visits and more services delivered overall. About 19% reflects caring for sicker, more complex patients, as hospitals devote more staff time, monitoring and specialized treatment to each case. The remaining 45% reflects higher costs per patient stay, including rising wages and benefits for clinical and other staff and higher prices for drugs, supplies and equipment. Put differently, a little over half of the growth in hospital expenses is explained by the fact that hospitals are caring for more patients who are sicker, while just under half reflects the higher cost of the people, medicines and materials required to care for them.
Importantly, the same forces contributing to higher acuity also are shaped by payer mix. An aging population increases the share of patients with multiple chronic conditions, as well as the resources required per admission and per visit. It also means an increase in the share of hospital care financed through Medicare. As a result, hospitals can experience the “more patients, sicker patients” dynamic at the same time that average reimbursement shifts toward payers that are less likely to cover the full cost of care. In 2024, Medicare reimbursed hospitals at just 83 cents on the dollar resulting in over $100 billion in underpayments. This places added pressure on other payers to cover shortfalls to ensure that access isn’t eroded.
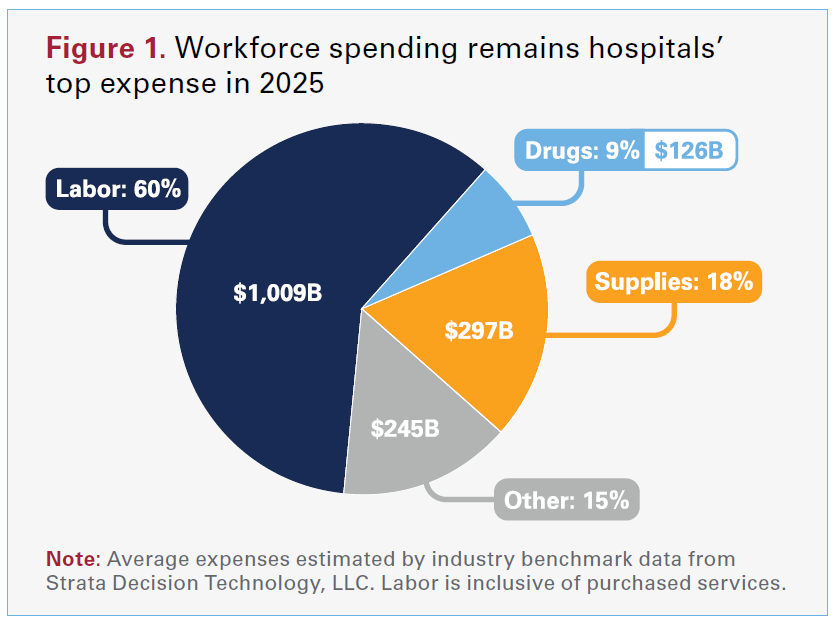
Workforce remains hospitals’ largest expense, so wage pressure shows up quickly in total spending. Hospitals spent more than $1 trillion in 2025 paying dedicated health care workers (see Figure 1). With many hospitals operating on margins that are breakeven or just above breakeven, even modest increases in labor costs are difficult to manage. In 2025, workforce costs rose 5.6% as hospitals increased wages to recruit and retain nurses, physicians and other staff. Advertised salaries for registered nurses have averaged 5.5% growth over the last two years — more than double the rate of inflation — according to AHA analysis of data from Lightcast.
At the same time, it has become increasingly difficult for physicians to sustain independent practices amid rising administrative and infrastructure demands coupled with reimbursement constraints — conditions that can put community access at risk. In that environment, more practices are turning to employment models, and hospitals’ acquisitions appear increasingly oriented toward preserving access to essential, lower-margin services.
Taking practices into employment often requires ongoing financial support, even before considering one-time acquisition and integration costs. Hospitals inherit the infrastructure that many independent practices increasingly struggle to finance and manage, including IT and EHR systems, billing and coding, quality reporting, compliance, cybersecurity and the administrative burden of payer policies. For example, hospitals spent roughly $30 billion in 2025 on the technology and services needed to protect their systems, data, and operations from cyber threats. That infrastructure is essential to keeping doors open in the community, but it adds real ongoing cost.
Kaufman Hall, a health care consulting company, estimates the median investment/subsidy required for employed physicians at $317,409 per physician FTE (Q2 2025). Yet hospital acquisitions are concentrated in essential, lower-margin community specialties — hospitals accounted for 94% of acquired physicians in pediatric medicine, and 71% of physicians acquired by hospitals were in family or pediatric medicine (2019–2024). By contrast, hospitals accounted for less than 3% of acquired physicians in higher-margin specialties like dermatology, gastroenterology and cardiology — specialties more commonly targeted by other acquirers, like commercial insurers or other corporate entities. Taken together, the pattern is consistent with hospitals absorbing ongoing practice-support costs to maintain access to services that are essential but less attractive on pure margin economics.
Hospitals also are facing rising administrative costs tied to commercial insurer requirements that add complexity to delivering and paying for care. In 2025, hospitals spent nearly $18 billion on overturning claims denials alone. All told, using data from the most recent annual survey, the AHA estimates that hospitals spent a staggering $43 billion in 2025 trying to collect payments insurers owe for care already delivered.3 Prior authorization, claims denials, repeated documentation requests, and evolving billing and coverage rules require hospitals to staff large billing, coding, utilization management, and appeals teams, while also pulling clinicians away from direct patient care to complete forms, peer-to-peer reviews and medical necessity documentation. In 2024, the average hospital employed about 64 administrative and billing staff dedicated to these functions — roughly 6.5% of total hospital employment — according to AHA analysis of annual survey data. These administrative demands can be especially acute for complex patients and for services with higher denial rates, compounding pressure on hospital resources. Administrative burden is one of the top contributors to clinician burnout, which adds to the workforce challenges across the country.
 These burdens are particularly visible in Medicare Advantage (MA), where claim denials are both common and administratively costly. A Health Affairs analysis found that MA plans denied about 17% of initial claims submissions, and that 57% of denials were ultimately overturned, meaning a large share of denials result in delayed (rather than avoided) payment after substantial back-and-forth. The authors estimated that denials were associated with a 7% net reduction in provider MA revenue (based on denials not overturned), highlighting both the direct financial impact and the broader “friction costs” providers incur even when claims are eventually paid.
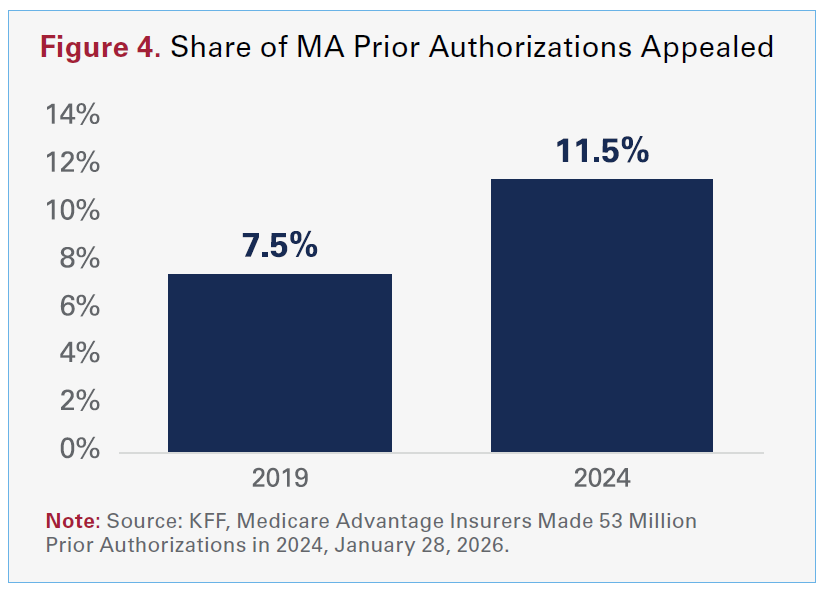
This is relevant especially considering MA insurers made nearly 53 million prior authorization determinations in 2024, or around 1.7 prior authorization requests per enrollee. The share of these prior authorizations that providers have needed to appeal has increased from 7.5% in 2019 to 11.5% in 2024 (see Figure 4).
Beyond the staffing burden, administrative friction can delay payment and increase bad debt — which was up 10% in 2025 — creating additional financial strain even when hospitals ultimately prevail on medical necessity. In an environment where margins are thin, these costs and delays reduce hospitals’ ability to invest in workforce, technology and capacity — and can contribute to delayed care when approvals or appeals slow down treatment decisions.
Hospitals also face faster growth in the cost of the supplies and equipment used in nearly every patient encounter. Total spending on supplies increased 9.9% through 2025, reflecting higher prices for everything from basic medical disposable gloves to pacemakers, ventilators and other technology that clinicians rely on every day. Hospitals routinely make large capital investments to acquire the equipment and technology essential for high-acuity care. Advanced surgical navigation systems can cost roughly $215,000–$350,000, and UV disinfection robots used to reduce hospital-acquired infections can run about $125,000. Even core infrastructure for 24/7 critical care is expensive at the unit level. An ICU-capable bed can cost $25,000–$30,000 each, and life-support equipment like ECMO and cardiopulmonary bypass systems average roughly $85,000 and $325,000, respectively, and often multiple units are required depending on patient volume and service capacity. NICUs also depend on high-cost technology per bed — incubators cost about $35,000, ventilators/CPAP machines about $50,000, plus multiple monitoring and feeding devices that can exceed $15,000 per bed.
AHA analysis of Lightcast labor market analytics data from 2024 shows that hospitals spent over $10 billion on surgical and medical instruments (+7% from 2023), nearly $4.5 billion on computing infrastructure and data processing (+15% from 2023), and nearly $1.4 billion on diagnostic imaging equipment (+8% from 2023). Hospitals also are dealing with more expensive global supply chains, higher transportation and raw-material costs. And hospitals often have limited ability to switch products quickly given that clinicians standardize care around specific devices for safety and outcomes, and many categories of supplies are dominated by a small number of vendors.
In addition, caring for sicker patients often requires more intensive use of supplies per case — more implants, more dressings and more specialized devices — so hospitals are paying more and using more in order to deliver the same or better standard of care. The result is a double pressure — higher prices per unit and higher utilization per case as patient complexity rises.
Drug spending stands out as a particular pressure point. Hospital drug expenses increased 13.6% in 2025, making pharmaceuticals one of the fastest-growing components of the hospital cost structure. This growth reflects a combination of rising prices on existing medications and the rapid adoption of new, high-cost therapies — notably oncology drugs and other specialty agents that can cost tens or even hundreds of thousands of dollars per patient. Academic medical centers, which treat some of the most complex patients and use some of the most expensive drugs on the market, saw drug expenses increase by 21.6% in 2025 alone.
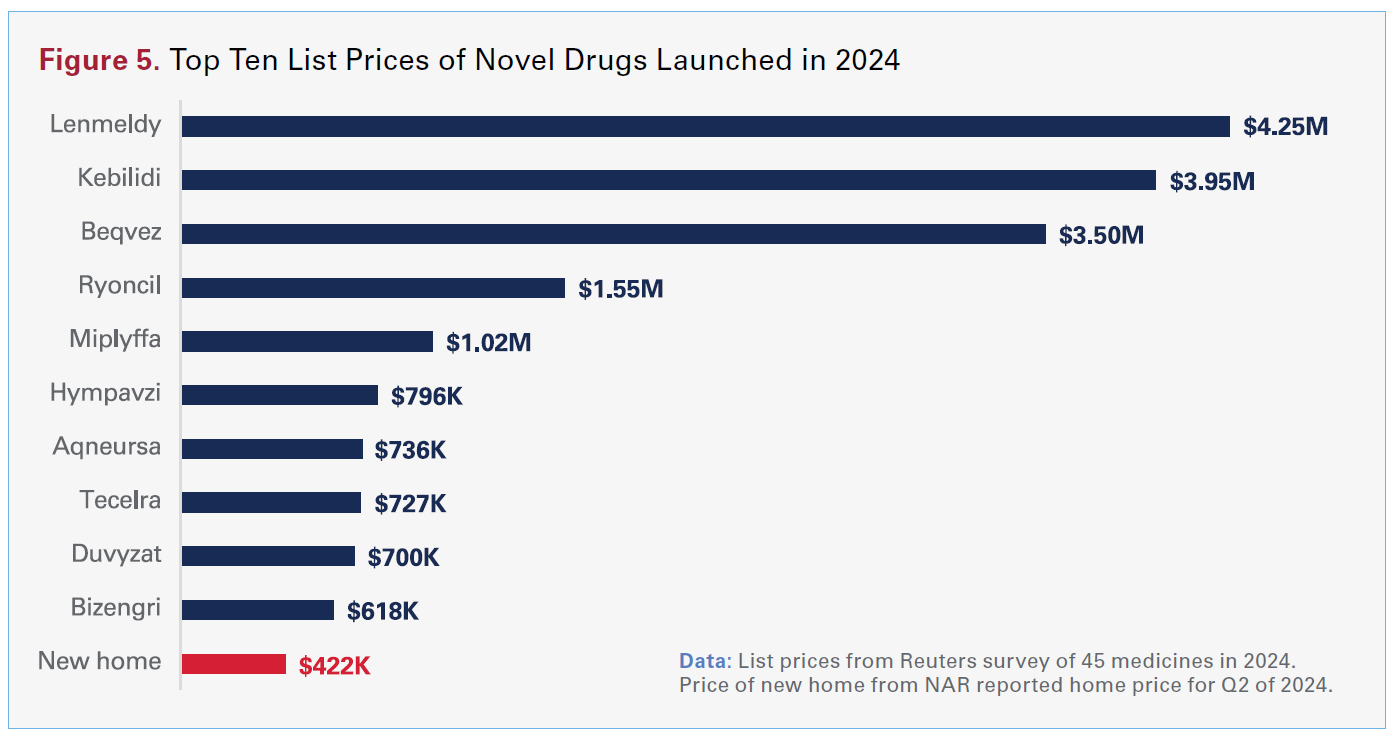
Hospitals also are uniquely exposed because many high-cost medicines are administered in hospital and hospital outpatient settings. Despite being major purchasers, often with group purchasing support, hospitals are frequently “price-takers” in the face of manufacturer pricing decisions and repeated price increases that leave little time to plan. National trends reinforce this dynamic. The average launch price of a new drug in 2024 was over $370,000 (up 23% from the prior year), and hundreds of drugs have experienced price increases above general inflation (see figure 5). Even when list price increases appear incremental, the compounded impact across thousands of products materially raises the cost of delivering care.
Hospital payments, which constitute the hospital share of the NHE, bundle together clinical services and large pass-through costs, especially for hospital administered drugs, supplies and devices. In other words, what appears in the NHE data as hospital spending actually includes substantial costs for things like the drugs that hospitals must purchase for patient care, including expensive oncology drugs or CAR-T. When those inputs are reassigned to the NHE categories that reflect the underlying products, like drugs, the hospital share of total health spending falls from just under one third to roughly one fourth, while the prescription drug share rises substantially.4,5
These pressures are compounded by drug supply chain instability and payer policies that introduce new costs without improving patient outcomes. Hospitals must devote substantial staff time and resources to manage drug shortages, implement workarounds and secure alternative supplies — all while maintaining patient safety and continuity of care. In addition, insurer-mandated “white bagging” and “brown bagging” policies disrupt hospital pharmacy safeguards, delay time-sensitive treatment and increase administrative burden. These policies require hospitals to obtain clinician-administered drugs through insurer-selected specialty pharmacies rather than through their own hospital pharmacy systems. Together, high drug prices, frequent price changes by drug manufacturers, and supply chain inefficiencies create one of the most variable and difficult-to-predict components of hospital budgets. While it cannot be overstated how clinically transformative many of these medicines provided in hospital settings are for patients, the cost increasingly threatens patients’ access to them.
Hospitals operate as the community’s all-purpose safety net, keeping a wide range of essential services available around the clock whether or not those services pay for themselves. Many of these are exactly the types of services communities rely on in moments of clinical urgency, including behavioral health, infectious disease, burn and wound care, and other highly specialized or low-volume services. Maintaining these capabilities requires 24/7 staffing, on-call specialists, dedicated units, and expensive equipment, even when patient volumes are unpredictable or reimbursement is chronically inadequate.
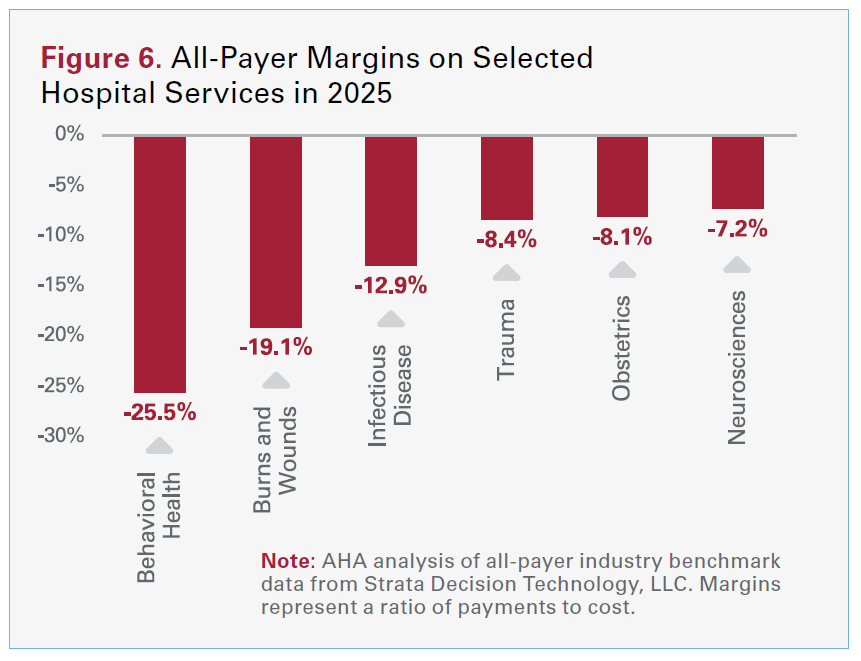 In the aggregate, well over half (56.1 percent) of hospital costs are tied to service lines where reimbursements fall short, or is less than, the cost to deliver care, like behavioral health, obstetrics, infectious disease, and burns and wounds. For example, an AHA analysis of industry benchmark data from Strata Decision Technology, LLC found that behavioral health services had an all-payer payment-to-cost ratio of 74.5% — meaning hospitals received only about three-quarters of what it costs to deliver that care (see Figure 6). These kinds of lossleading services are not optional for hospitals to provide; they are core to hospitals’ role in their communities, and the costs of standing ready in these areas must be cross-subsidized from the few services that do generate positive margins.
Importantly, this is not simply a story of public payer shortfalls. Even within commercial insurance, prices are uneven across service lines — commercial contracts do not consistently “make hospitals whole” for the services that are hardest to staff and sustain. In an AHA analysis of more than 53 million publicly posted negotiated commercial PPO prices (each expressed as a commercial-to-Medicare ratio) across 4,159 hospitals aggregated by Turquoise Health, inpatient behavioral health and obstetrics, for example, were priced below the other inpatient services. Specifically, their commercial-to-Medicare ratios were 87.1% and 92.8% of the average inpatient service-line ratio in this sample —about 13% and 7% lower than the inpatient average, respectively. More broadly, inpatient service lines averaged 83.3% of outpatient service-line levels in this commercial PPO sample, reflecting a pattern where some of the most resource-intensive, around-the-clock services are reimbursed at lower relative levels.
This pattern is consistent with a broader shift toward outpatient care. In 2020, 52% of hospital revenues were from outpatient services; by 2024, that figure had climbed to 57%, according to data from Moody’s.
These data and trends help explain why hospital expenses continue to grow, outpacing growth in hospital prices. In other words, despite hospitals facing higher labor and input costs, treating more patients with greater clinical complexity, and maintaining essential, always-on services that communities depend on, they have managed to keep price increases below the increases in their input costs. However, this mismatch between expenses and revenue leaves hospitals increasingly at risk of being able to maintain the full spectrum of services on which communities rely.