2021 Cost of Caring

October 2021


Hospitals and health systems work hard every day to make care more cost-effective and efficient for their patients, at the same time that they are caring for the nation’s most complex and resource-intensive patients. This has been especially true during the COVID-19 pandemic as hospitals and health systems have provided essential services and saved lives, while also facing unprecedented financial and operational challenges.

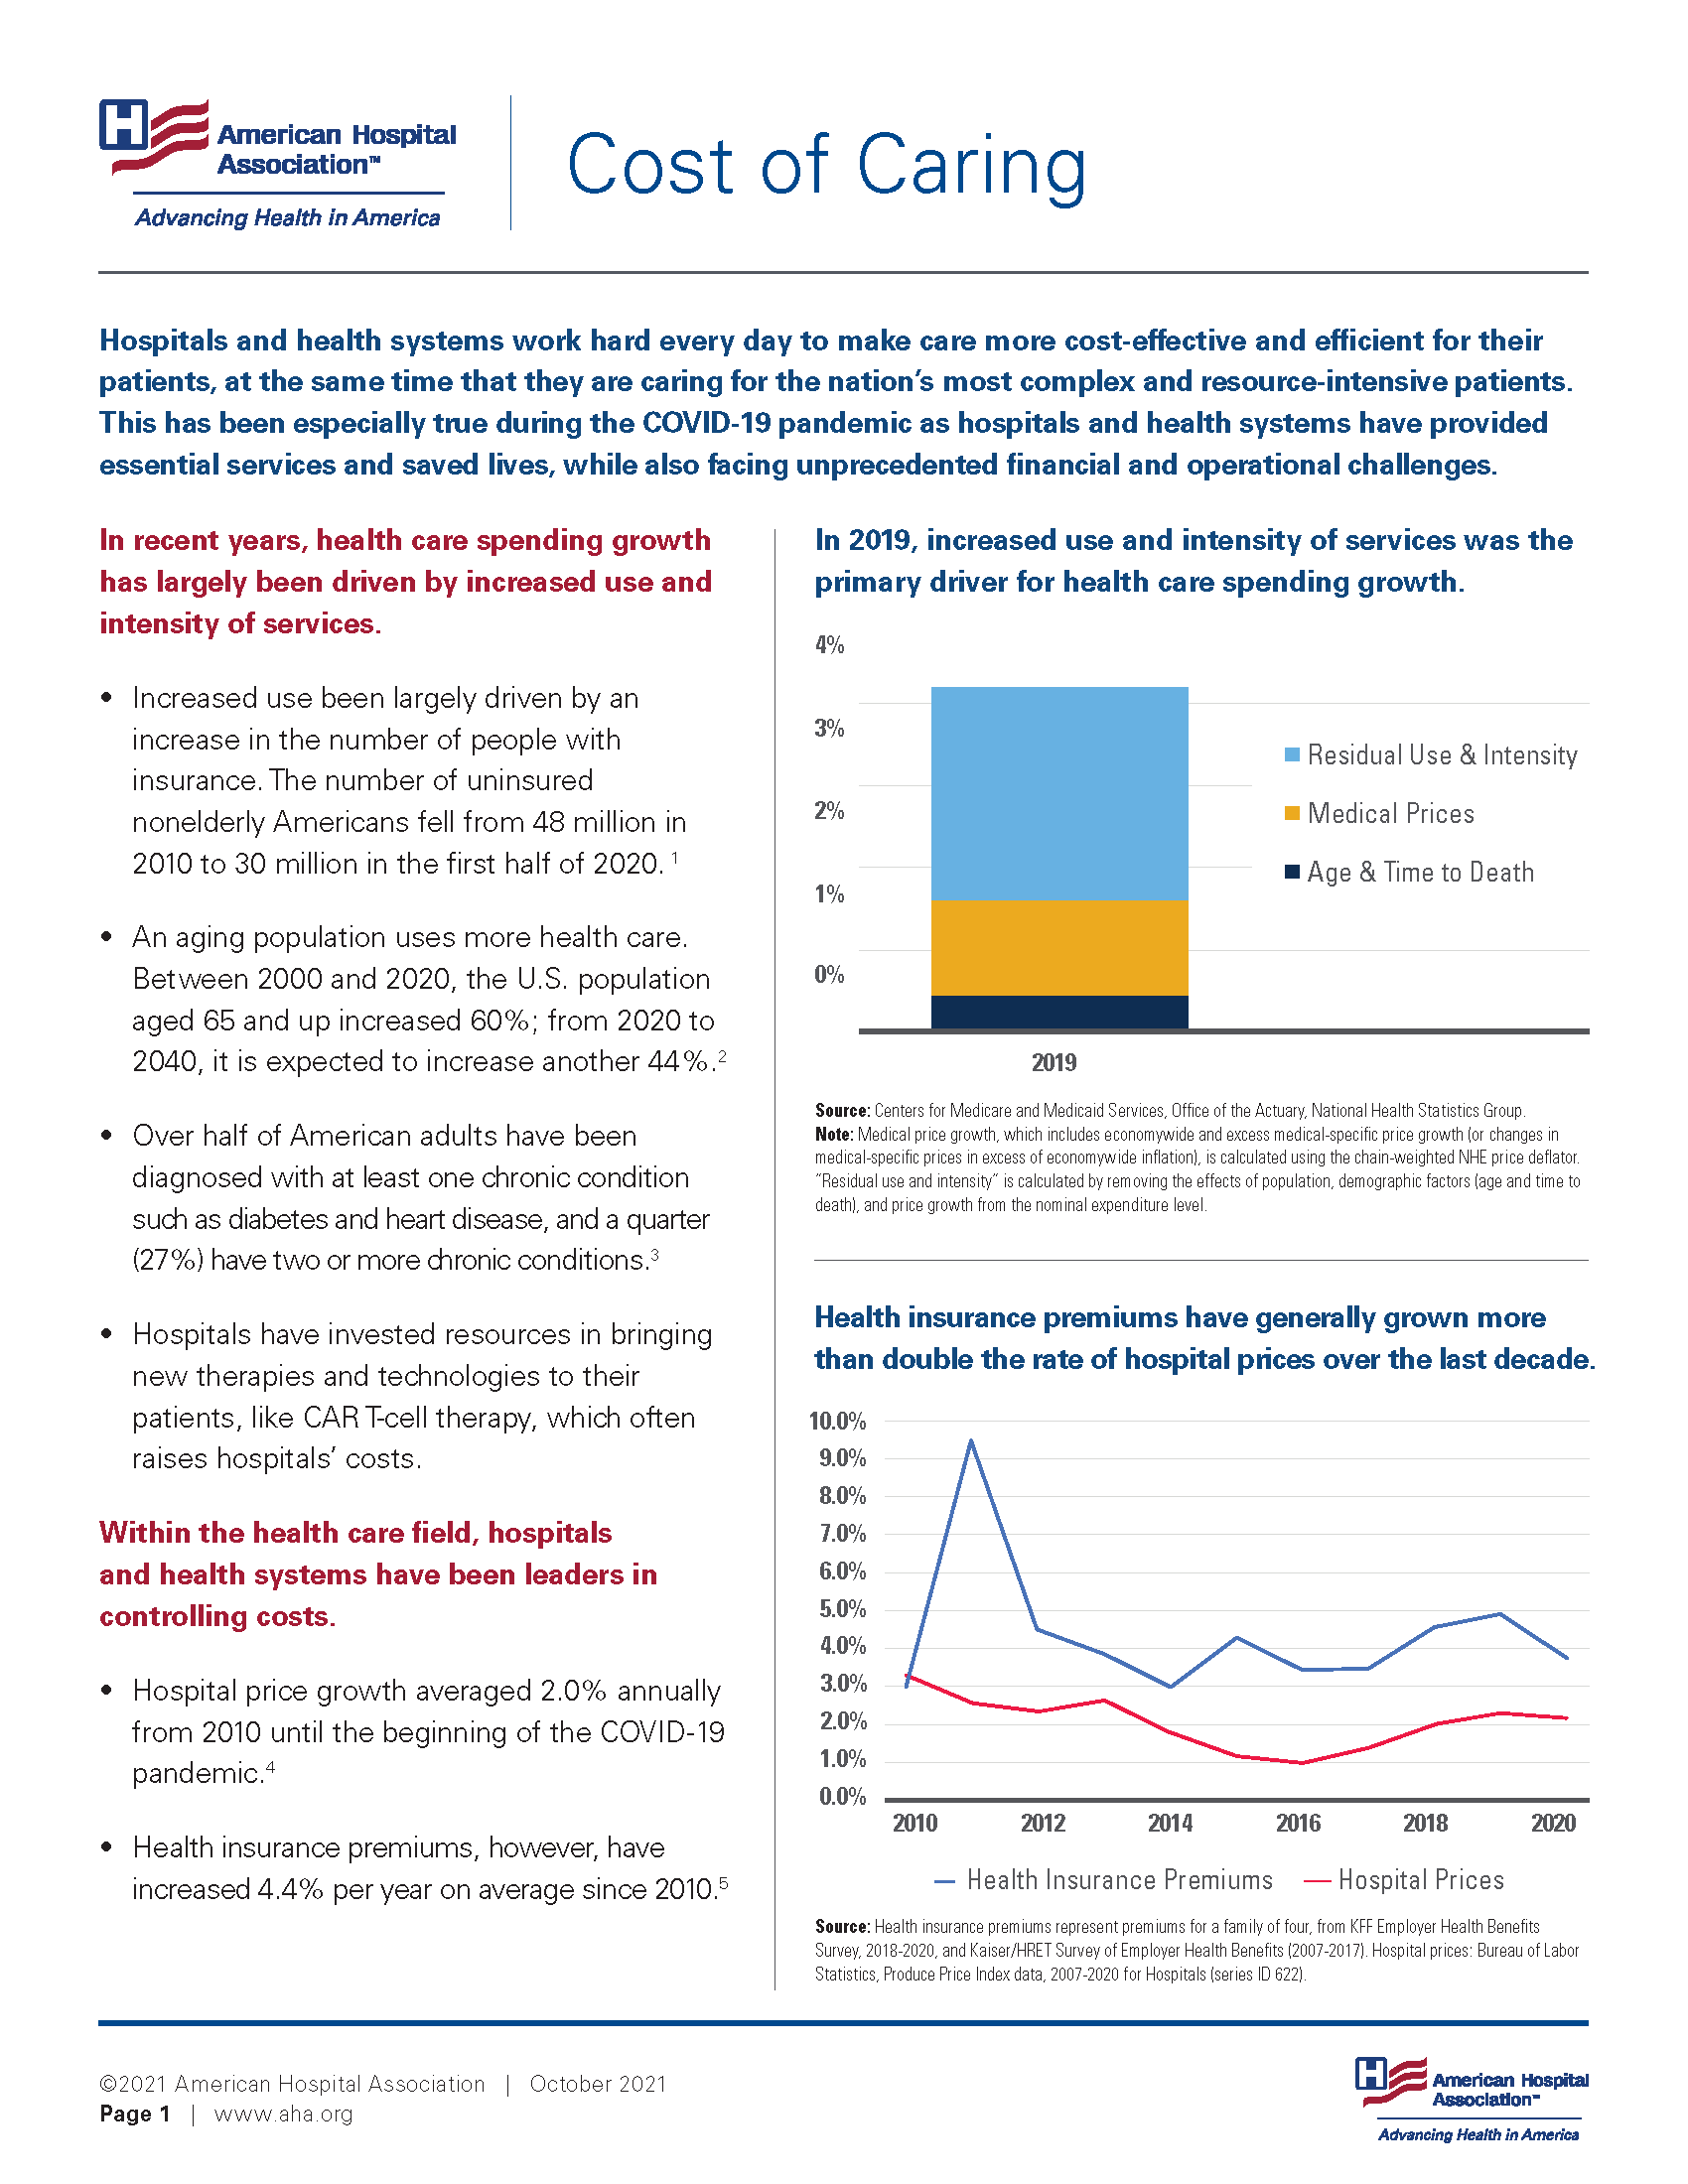
In recent years, health care spending growth has largely been driven by increased use and intensity of services.

  • Increased use been largely driven by an increase in the number of people with insurance. The number of uninsured nonelderly Americans fell from 48 million in 2010 to 30 million in the first half of 2020.1
  • An aging population uses more health care. Between 2000 and 2020, the U.S. population aged 65 and up increased 60%; from 2020 to 2040, it is expected to increase another 44%.2
  • Over half of American adults have been diagnosed with at least one chronic condition such as diabetes and heart disease, and a quarter (27%) have two or more chronic conditions.3
  • Hospitals have invested resources in bringing new therapies and technologies to their patients, like CAR T-cell therapy, which often raises hospitals’ costs. Within the health care field, hospitals and health systems have been leaders in controlling costs.
  • Hospital price growth averaged 2.0% annually from 2010 until the beginning of the COVID-19 pandemic.4
  • Health insurance premiums, however, have increased 4.4% per year on average since 2010.5

In 2019, increased use and intensity of services was the primary driver for health care spending growth.

In 2019, increased use and intensity of services was the primary driver for health care spending growth. Residual Use & Intensity; Medical Prices; Age & Time to Death.

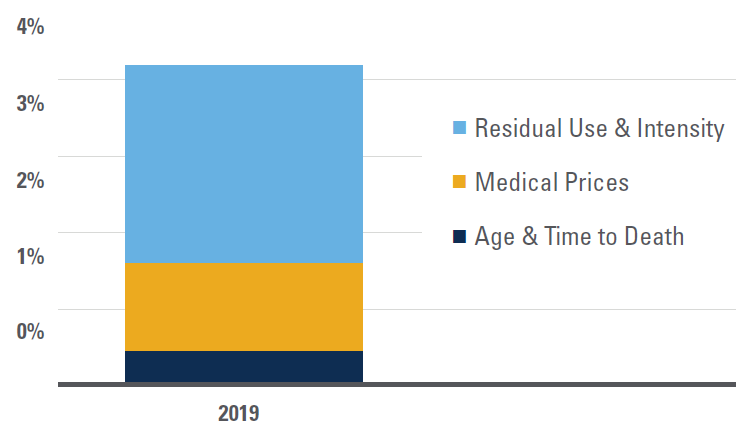
Source: Centers for Medicare and Medicaid Services, Office of the Actuary, National Health Statistics Group. <Note: Medical price growth, which includes economywide and excess medical-specific price growth (or changes in medical-specific prices in excess of economywide inflation), is calculated using the chain-weighted NHE price deflator. “Residual use and intensity” is calculated by removing the effects of population, demographic factors (age and time to death), and price growth from the nominal expenditure level.


Health insurance premiums have generally grown more than double the rate of hospital prices over the last decade.

Health insurance premiums have generally grown more than double the rate of hospital prices over the last decade.

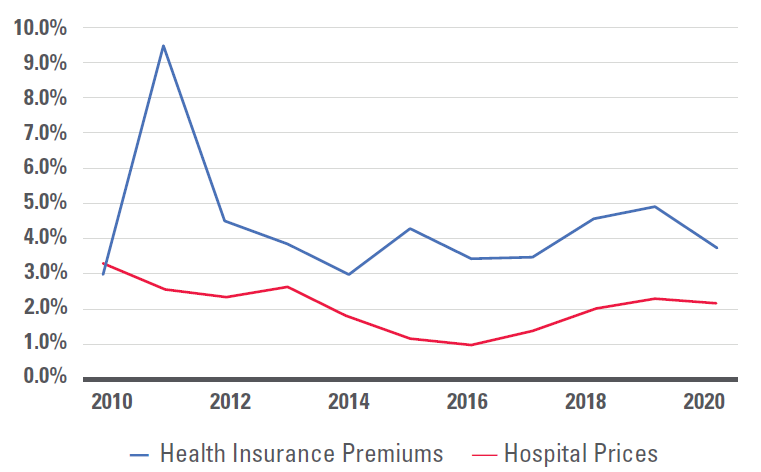
Source: Health insurance premiums represent premiums for a family of four, from KFF Employer Health Benefits Survey, 2018-2020, and Kaiser/HRET Survey of Employer Health Benefits (2007-2017). Hospital prices: Bureau of Labor Statistics, Produce Price Index data, 2007-2020 for Hospitals (series ID 622).


Hospital care requires a range of inputs such as wages, prescription drugs, food, medical devices, utilities and professional insurance. Steep increases in input prices, like rapidly escalating drug prices, can undermine hospitals’ efforts to reduce the cost of care.

  • Wages and benefits account for well over half of inpatient hospital costs, reflecting the importance of people in the care process.
  • Drug prices for purchases directly from manufacturers, including those by hospitals and other providers, increased at nearly twice the rate of retail drug prices over the last decade.6
  • Medical devices also factor into the cost of care. Life-saving items such as cardiac defibrillators typically cost more than $20,000, while higher complexity models can cost roughly $40,000. Common items like artificial knees and hips often cost in excess of $5,000.
  • Hospitals are also investing in new technologies and improving how care is delivered. In 2017 alone, hospitals invested more than $62 billion in electronic health records and other IT systems that record, store and transfer patient data securely among medical professionals.7
  • Hospitals deal with over 1,000 insurers, which typically have several different plan options.8 Meeting the unique requirements of these payers, including extensive government regulations, results in tremendous administrative and cost burden to hospitals and health systems.

Employee wages and benefits constitute the largest percentage of costs for inpatient hospital services.

Employee wages and benefits constitute the largest percentage of costs for inpatient hospital services. Wages and Salaries: 56%; Drugs: 6%; Other Products: 12%; Other services: 28%.

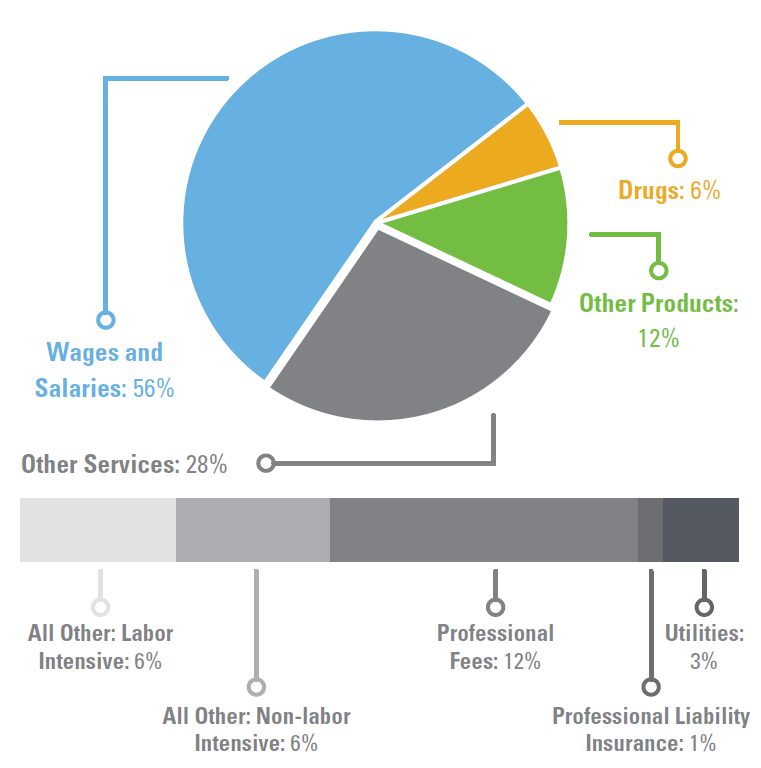
Source: AHA Analysis of Centers for Medicare & Medicaid Services FY18 IPPS Market Basket Data, Using base year 2014 weights. (1) Does not include capital. (2) Includes postage and telephone expenses.


Changes in Expense YTD as Compared with Pre-Pandemic Levels

Changes in Expense YTD as Compared with Pre-Pandemic Levels. Drug Expense per Adjusted Discharge: 24%; Supply Expense per Adjusted Discharge: 17%; Non-Labor Expense per Adjusted Discharge: 17%; Purchased Service Expense per Adjusted Discharge: 15%; Total Expense per Adjusted Discharge: 15%; Labor Expense per Adjusted Discharge: 14%.

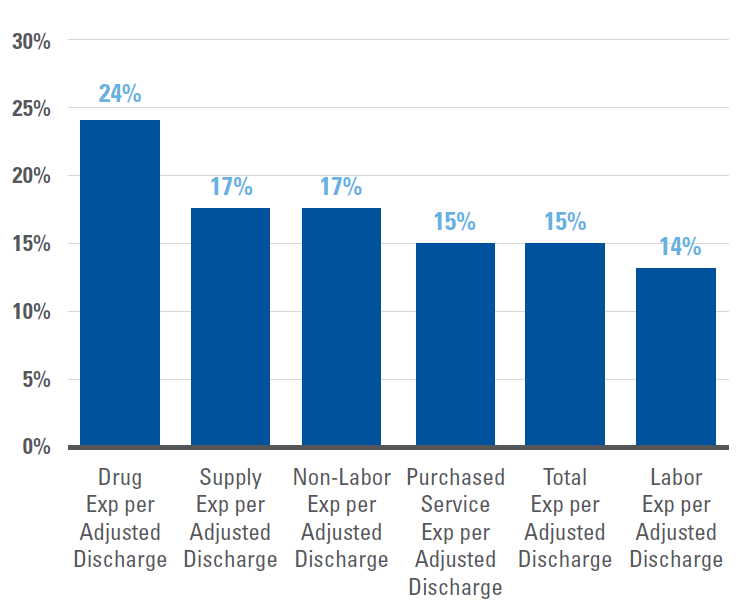
Source: Kaufman Hall's September 2021 Report "Financial Effects of COVID-19: Hospital Outlook for the Remainder of 2021.”


The COVID-19 pandemic heightened a number of these pressures, with significant challenges and economic uncertainty remaining.

  • Mandated shutdowns of non-emergent services and avoided care led to massive declines in patient volume, including needed care.
  • The complexity of care for the remaining patients rose dramatically as a result of having cared for over three million COVID-19 hospitalizations, as well as higher acuity from deferred care.9
  • Hospitals and health systems experienced dramatic increases in expenses as a result of this care complexity, supply chain challenges and labor shortages. A recent analysis of workforce data by Premier found: staffing shortages have cost hospitals approximately $24 billion over the course of the pandemic so far; hospitals have also spent an additional $3 billion in acquiring personal protective equipment (PPE) for the additional staff; and hospitals’ use of contract temporary labor is up 132% for full-time and 131% for part-time staff.10
  • As a result of the continued effects of the COVID-19 pandemic, hospitals and health systems are projected to lose at least $54 billion in net income in 2021, with more than a third of hospitals expected to have negative operating margins through year’s end.11
  • Despite these billions in losses for hospitals, perhaps the greatest toll of the pandemic has been felt by hospital workers who have seen first-hand the devastating human impacts of the pandemic. A Kaiser Family Foundation/Washington Post poll found that about 3 in 10 health care workers considered leaving their profession, and about 6 in 10 said pandemic-related stress had harmed their mental health. A survey conduced by the AHA's American Organization for Nursing Leadership found that one of the top challenges and reasons for healthcare staffing shortages reported by nurses was “emotional health and wellbeing of staff."12,13
  • The after effects of deferred care and trauma from the pandemic will continue into the future.14 Researchers found nearly 10 million cancer screenings were missed in 2020. Providers are already seeing higher level acuity cancer among previously undiagnosed patients, a trend which may last for years.15,16
  • This is the first time in 100 years we’ve emerged from an international pandemic, the effects of which are rippling through the economy, with early indicators pointing toward economy-wide inflation.17
  • New drugs and products, especially as the specialty drug market continues to grow, will drive costs up for consumers and hospitals and health systems alike; the first new FDA-approved Alzheimer's drug in nearly twenty years, Aduhelm, will have a list price of $56,000 and may increase total National Health Expenditures by more than a percent on its own.17,18 Medicare spending on retail drugs alone increased 26% from 2013 through 2018, mostly attributable to higher prices rather than more utilization.19

To learn more about how hospitals are driving value and affordability, and how the AHA is promoting these principles, visit: https://www.aha.org/issue-brief/2019-09-18-real-affordability-solutions-front-lines-caring.


Sources

  1. https://aspe.hhs.gov/system/files/pdf/265041/trends-in-the-us-uninsured.pdf
  2. https://www.census.gov/data/tables/time-series/demo/foreign-born/acs-42.html
  3. https://www.cdc.gov/pcd/issues/2020/20_0130.htm
  4. Bureau of Labor Statistics PPI data for hospitals, series ID 622
  5. KFF Employer Health Benefits Survey, 2020.
  6. Bureau of Labor Statistics PPI data for pharmaceutical manufacturing series ID 3254; CPI data for pharmacy, series ID CUUR0000SEMF01
  7. https://www.aha.org/system/files/2019-01/Report01_18_19-Sharing-Data-Saving-Lives_FINAL.pdf
  8. https://content.naic.org/sites/default/files/inline-files/2019%20Health%20Industry%20Commentary_0.pdf
  9. https://covid.cdc.gov/covid-data-tracker/#new-hospital-admissions
  10. https://www.premierinc.com/newsroom/blog/pinc-ai-data-shows-hospitals-paying-24b-more-for-labor-amid-covid-19-pandemic
  11. https://www.aha.org/guidesreports/2021-09-21-financial-effects-covid-19-hospital-outlook-remainder-2021
  12. https://www.washingtonpost.com/health/2021/04/22/health-workers-covid-quit/
  13. https://www.aonl.org/resources/nursing-leadership-covid-19-survey
  14. https://www.pwc.com/us/en/industries/health-industries/library/behind-the-numbers.html
  15. https://jamanetwork.com/journals/jamaoncology/fullarticle/2778916
  16. https://www.modernhealthcare.com/care-delivery/providers-see-sicker-cancer-patients-after-missed-screenings-and-care-during-covid-19
  17. https://www.washingtonpost.com/business/2021/06/10/inflation-cpi-may-prices/
  18. https://altarum.org/news/new-alzheimer-s-drug-projected-increase-national-health-expenditures-more-one-percent
  19. http://www.medpac.gov/docs/default-source/reports/jun21_medpac_report_to_congress_sec.pdf?sfvrsn=0